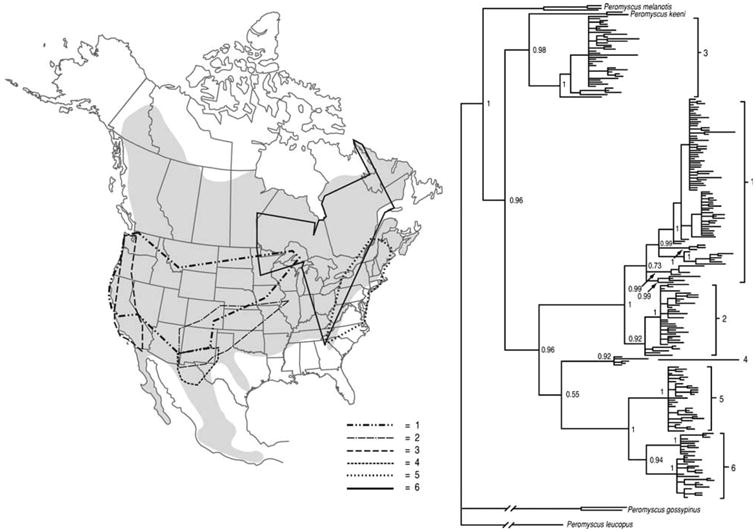
Figure 1.

Bayesian phylogeny of cytochrome b sequences from 311 P. maniculatus specimens on the basis of a GTR+I+G model of nucleotide substitution. Bayesian posterior probabilities are given above each branch. A similar topology was recovered in a maximum likelihood phylogeny of 40 randomly selected sequences; all labeled nodes were supported by >50% bootstrap values in 1000 pseudo replicates. The inset map of North America shows the geographic distribution of P. maniculatus (shaded region) and the six major cytochrome b clades.
