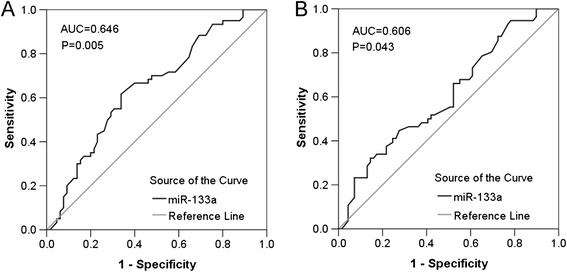
Figure 4.

ROC curves of miR-133a for clinicopathological factors of lung cancer. (A) ROC curve of miR-133a level for tumor size. The AUC was 0.646 (95% CI: 0.550 ~ 0.743, P = 0.005). (B) ROC curve of miR-133a level for lymphatic metastasis. The AUC was 0.606 (95% CI: 0.507 ~ 0.705, P = 0.043).
