
Figure 2.
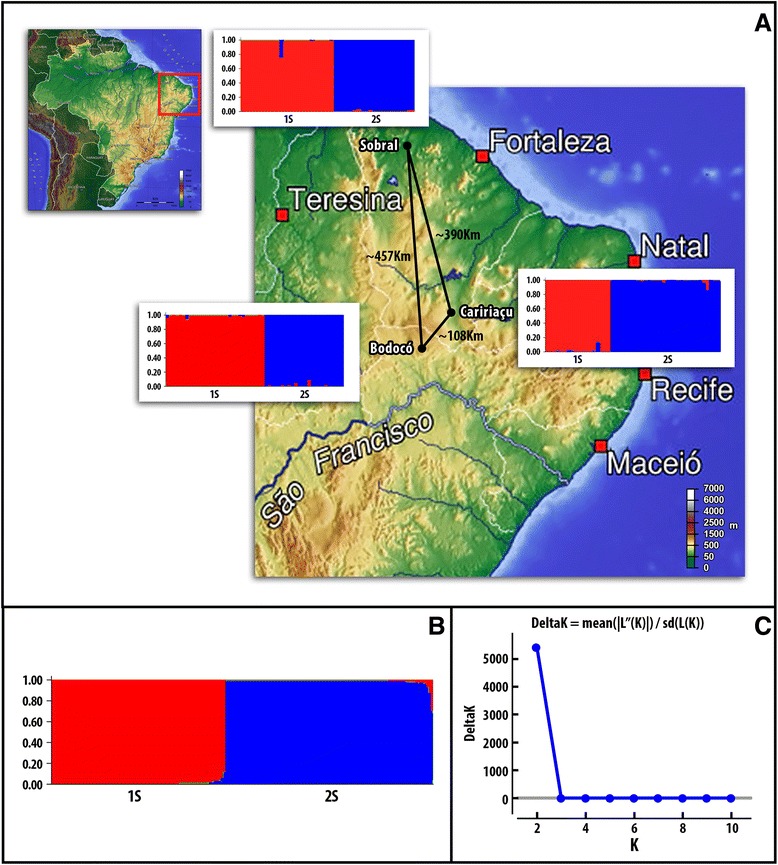
Elevation map and genetic assignment analysis. A: Relief map of Brazil (inset) and the distance between localities of Bodocó, Caririaçu and Sobral, which exhibits a very rugged topography ranging from 63 m to 900 m of altitude. The bar plots generated by the software STRUCTURE inferred the genetic structure of populations of L. longipalpis from each places studied. B: Genetic assignment from all localities, specimens 1S phenotype were assigned to the red group, and 2S specimens were assigned to the blue group. C: Delta K method [35] indicating the presence of two genetic populations.