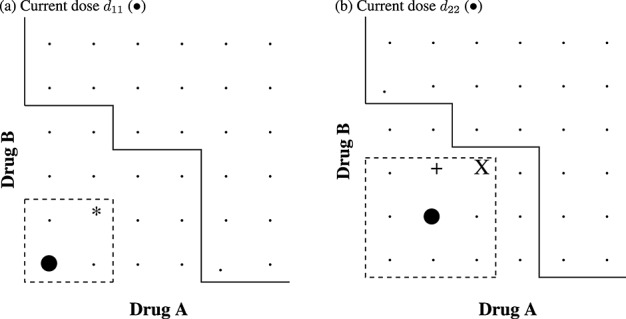
Figure 3.

The set of admissible doses that are closest and adjacent (X), adjacent but not closest (+) and largest (*) to C*(m) under a neighbourhood constraint. The solid line shows C*(m). The dashed line shows the current neighbourhood constraint (i.e. only dose combinations within the dashed box are admissible).
