
Figure 5.
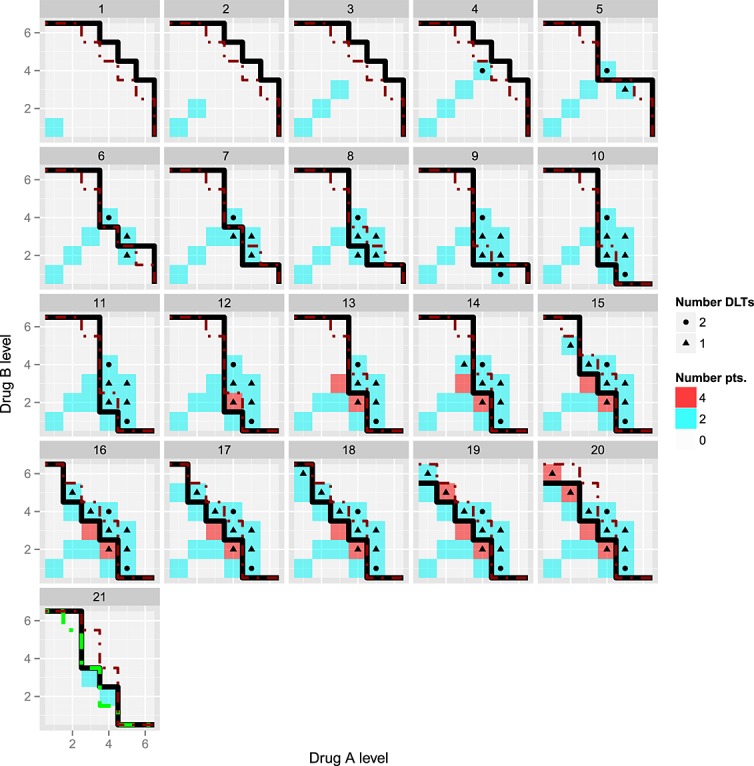
A single trial realisation simulated under scenario 3 using a neighbourhood constraint. Two patients per cohort were recruited sequentially from cohort 1 (top left panel) to cohort 20 (bottom right panel). Each subfigure m = 1,…,20 shows C*(m) (black solid line), the upper toxicity constraint (dashed red contour) based on doses whose posterior probability  as well as current and past experimentation (shaded boxes) and dose-limiting toxicities (symbols). Cohort 21 (bottom left panel) additionally shows the recommended phase II doses at the end of the trial (blue boxes) as well as the true MTCθ (dashed green line).