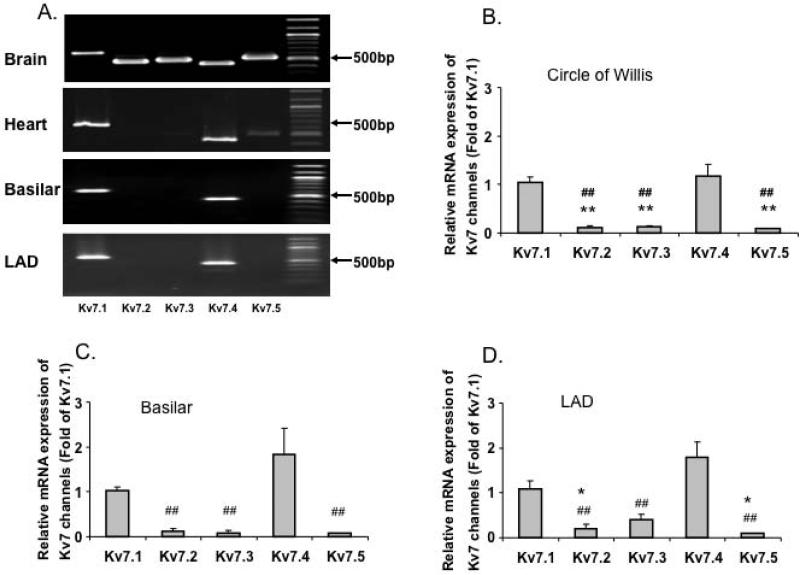
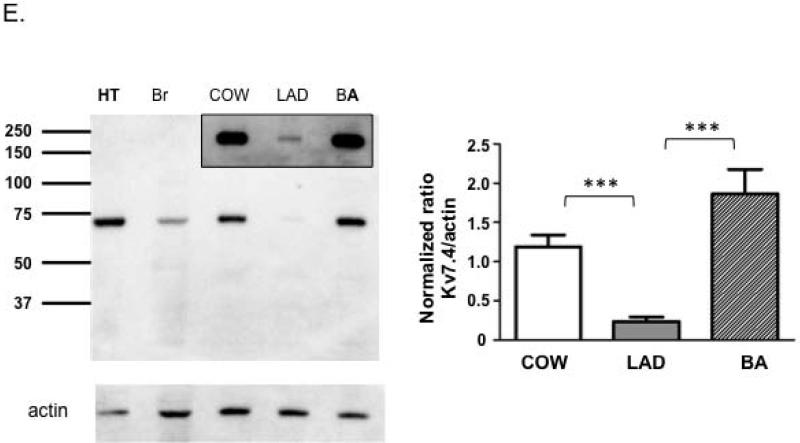
Figure 1. Vascular expression of Kv7 channels.
A. End-point PCR analyses of Kv7 channel subtypes in mouse brain, heart, cerebral and coronary arteries. B, C and D. Group data for quantitative PCR of Kv7 channel subtypes in mouse Circle of Willis (B, n = 5), basilar (C, n = 5 - 7) and LAD (D, n = 7 - 8) arteries. *P< 0.05, **P<0.01 vs. Kv7.1, ## P<0.01 vs. Kv7.4. E, Representative immunoblot for Kv7.4 protein in mouse Circle of Willis cerebral arteries (COW), basilar (BA) and proximal left anterior descending arteries (LAD). Heart (HT) and brain (Br) tissues are included as positive controls. Molecular mass standards are shown in kilo-Daltons. Group data show relative protein levels of Kv7.4 in COW (1.19 ± 0.15, n = 7), LAD (0.24 ± 0.15, n = 7) and BA (1.86 ± 0.32, n = 7). Y-axis is normalized ratio of Kv7.4 band intensity to loading control actin band intensity. Insert shows a longer exposure of the vessel bands to better illustrate the low amount of expression in the small coronary arteries. Results are mean ± SEM. ***P<0.001 (one-way ANOVA, Bonferroni post-hoc test).


