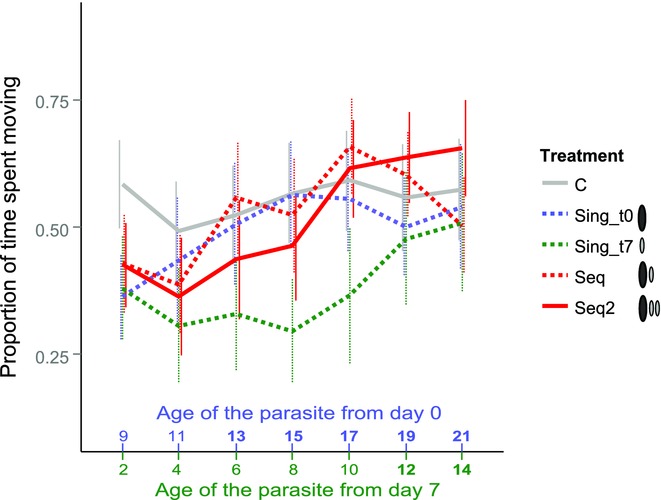
Figure 3.

Activity of copepods according to treatment, right after a simulated predator attack. Error bars indicate 95% CI. Bold numbers on the x-axis indicate that a parasite of that age was infective. C, unexposed control copepods; Sing_t0, copepods singly infected with one parasite on day 0; Sing_t7, copepods singly infected with one parasite on day 7; Seq, copepods sequentially infected with two parasites, one each on day 0 plus day 7; Seq2, copepods sequentially infected with three parasites, one on day 0 plus two on day 7.
