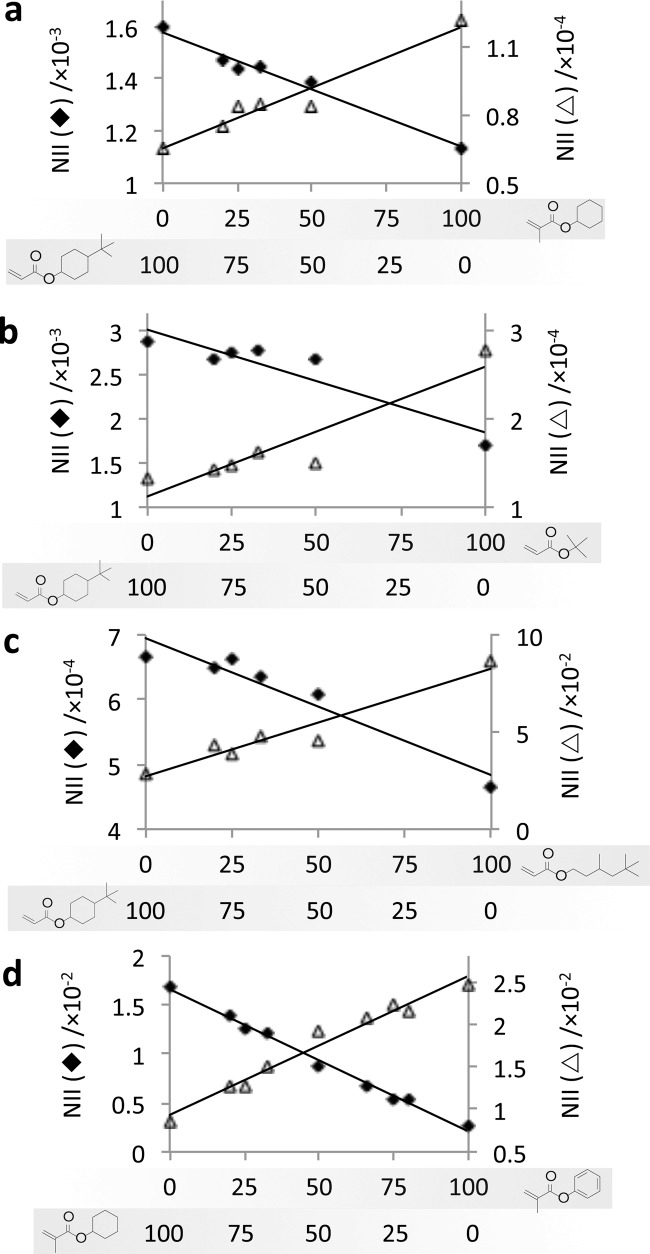
Figure 2.
Normalized ion intensity (NII) for representative SIMS ions for copolymers of t-BCHA with a) CHMA, b) t-BA, and c) TMHA and d) for copolymers of CHMA and BMA. The content (%) of each monomer is indicated below each graph. The ions for each graph are a) C4H4+ (♦) indicative of t-BCHA (R2 = 0.97) and C14H28O4+ (△) indicative of CHMA (R2 = 0.95), b) C4H6+ (♦) indicative of t-BCHA (R2 = 0.86) and C13H16O4+ (△) indicative of t-BA (R2 = 0.87), c) C4H2+ (♦) indicative of t-BCHA (R2 = 0.93) and C3H7+ (△) indicative of TMHA (R2 = 0.93), d) C6H11+ (♦) indicative of BMA (R2 = 0.99) and C6H5+ (△) indicative of CHMA (R2 = 0.97).

