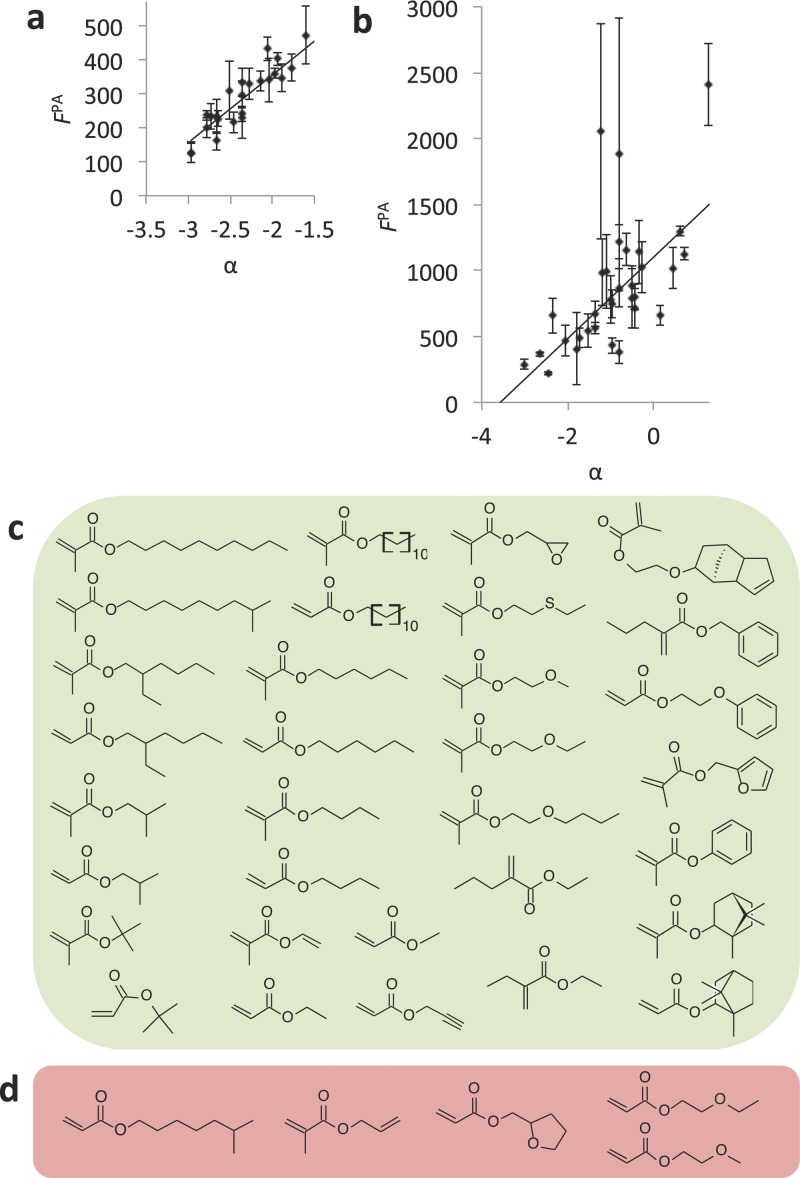
Figure 4.
a) Correlation between bacterial attachment with molecular flexibility and polarity. The fluorescence due to the attachment of P. aeruginosa (FPA) is plotted against the composite parameter α (R2 = 0.83) for each polymer used in this study. Error bars equal ±1 standard deviation unit, n = 6. b) Correlation between α and FPA on 37 homopolymers (R2 = 0.67). Two samples with FPA above 3000 that were unsuccessfully correlated with α are not shown to enable better visualization of those samples where a correlation was observed. The coordinates of these two samples are (1.2, 7700) and (0.1, 14600). Error bars equal ±1 standard deviation unit, n = 3. c,d) Chemical structures of the monomers of polymers whereby c) the bacterial attachment was successfully correlated with α, and d) higher bacterial attachment was measured than what was expected from assessing α.

