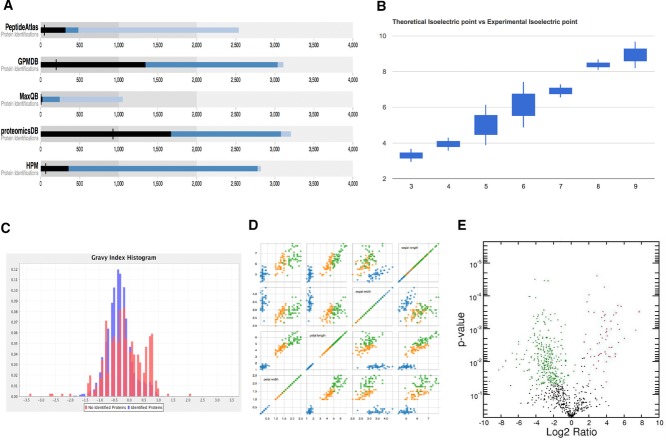
Figure 2.
Examples of charts: (A) bullet plots of identified proteins in different MS proteomics resources (original data published in [75]); (B) box plots of theoretical isoelectric point (x-axis) for seven experimental fractions (original data published in [39,40]); (C) histograms of gravy index of proteins non-identified in protein expression resources (original data published in Ref. [75]); (D) scatter plot matrix charts; and (E) volcano plot. (A) was generated using Google Charts, and (B) was generated using D3.js bullet plugin (https://github.com/d3/d3-plugins/tree/master/bullet), respectively; (C) and (D) were generated using JFreeChart and D3.js, respectively; (E) was generated using matplotlib.

