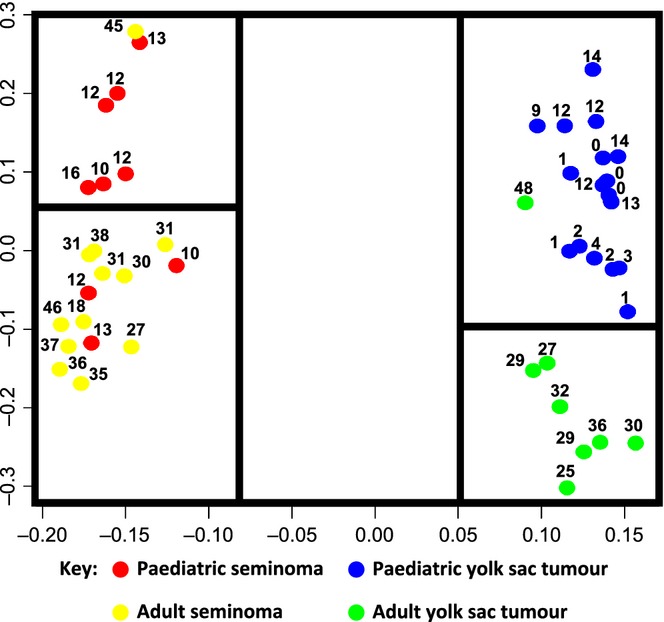
Figure 1.

Principal component analysis of paediatric and adult malignant germ cell tumour (GCT) protein-coding gene expression data [adapted from (Palmer et al., 2008)]. Each malignant GCT sample is represented by a coloured circle; the number next to the circle shows the age of the relevant patient in years. The distance between samples represents biological (protein-coding transcriptome) differences. Consequently, those samples clustering close together demonstrate biological similarity, whereas those that are segregated are more dissimilar.
