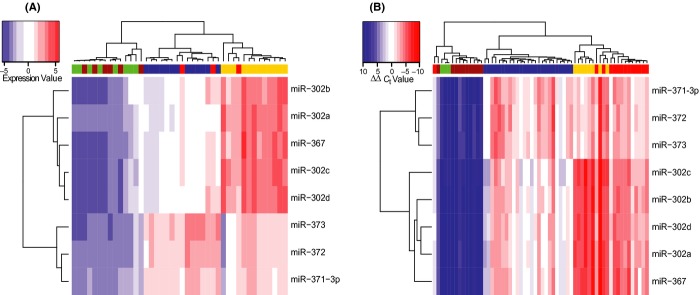
Figure 2.

Differential expression of the miR-371–373 and miR-302/367 clusters in malignant germ cell tumours (GCTs) [adapted from (Palmer et al., 2010)]. Hierarchical clustering analysis based on the eight main microRNAs from the miR-371–373 and miR-302/367 clusters (rows) segregates (A) paediatric and (B) adult malignant GCT samples from non-malignant controls (comprising benign teratomas and normal gonadal controls) (columns). In the heatmap, red represents relative microRNA over-expression and blue represents under-expression. Green columns = normal gonadal controls; brown = teratoma; blue = seminoma; yellow = yolk sac tumour; red = embryonal carcinoma.
