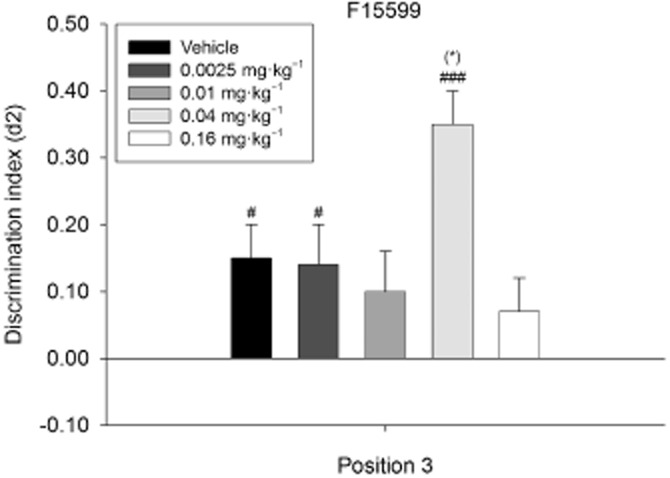
Figure 4.

Means + SEM for the d2 index in the OPS for F15599 treatment on position 3. The dose–response curve of F15599 on position 3 in the OPS task. Administration of 0.04 mg·kg−1 F15599 led to the best discrimination performance. #P < 0.05; ###P < 0.001, significantly different from chance performance/zero. (*)P = 0.079, different from the vehicle condition,. n = 23 animals per group.
