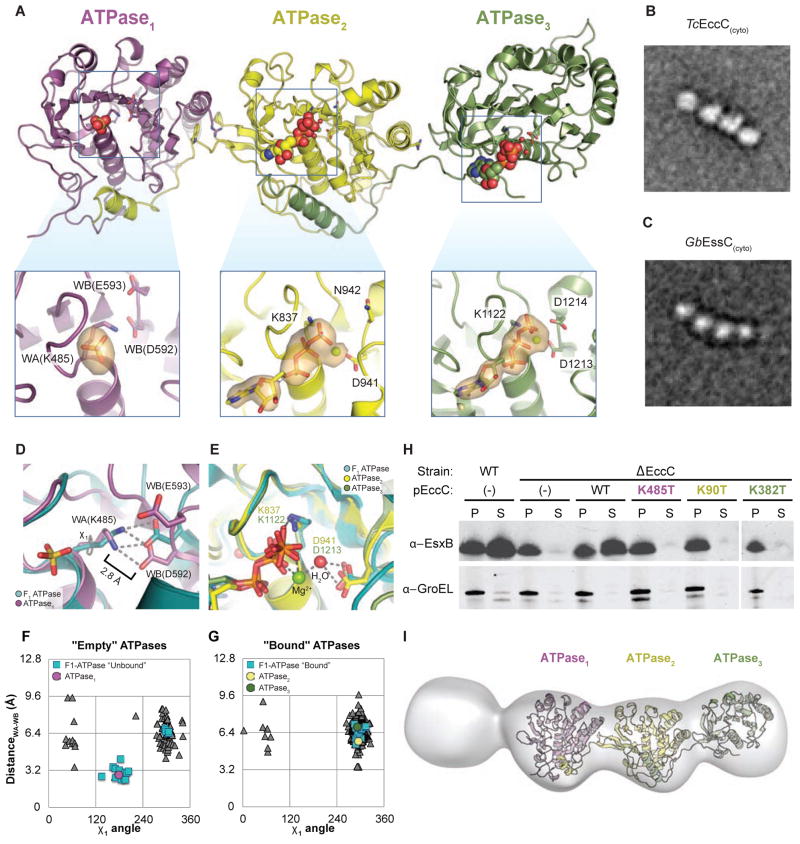
Figure 3. ATPase1 is autoinhibited and integrated into a ridged array of ATPase domains.
(A) The crystal structure of TcEccC(cyto) highlighting the differences between the ATP- bound catalytic sites of ATPase2 and ATPase3 and the nucleotide free site of ATPase1. The orange volume represents a simulated-annealing difference-density map calculated without nucleotide or sulfate and contoured at 3 σ. Note that the ATPase3 insert has been rotated slightly to allow for comparison between the ATPase active sites (B–C) Representative EM class average of (B) TcEccC(cyto) and ( GbC) EssC(cyto) showing the linear structure of EccC. Scale bars are 100 Å. (D) ATPase1 (purple), with the “empty” subunit of F1-ATPase (PDB 1H8H) overlaid in cyan and (E) ATPase2 (yellow) and ATPase3 (green) overlaid with the AMP-PNP-bound subunit of F1-ATPase (cyan) from 1H8H. (F) A graph representing the distance between the Walker A lysine amino group and the closest Walker B carboxylate oxygen, as a function of the rotameric position of the Walker A lysine. Each triangle represents one of 311 pdb chains of an ATP bound, P-loop ATPase identified by our protocol (see supplementary methods). (G) A similar graph to (F) except the triangle represents the residues of “empty” ATPases from PDB entries that contain both a bound and unbound P-loop ATPase domain in the same file. (H) Western blot detection of MtEsxB1 and GroEL from cell supernatants (S) and cell pellet lysate (P) fractions of MtEccC1 knockout and complemented cells. (I) Three- dimensional reconstruction at an estimated resolution of 23 Å, based on 1634 images in the presence of 1 mM ATP-γS and 10 mM MgCl2. The model has been contoured to fit the crystal structure. Though it is impossible to resolve the difference between the first and fourth domains, the electron density of one is much lower than the other three, suggesting this domain is the DUF domain, which is disordered in the crystal structure. Also see Figure S3.

