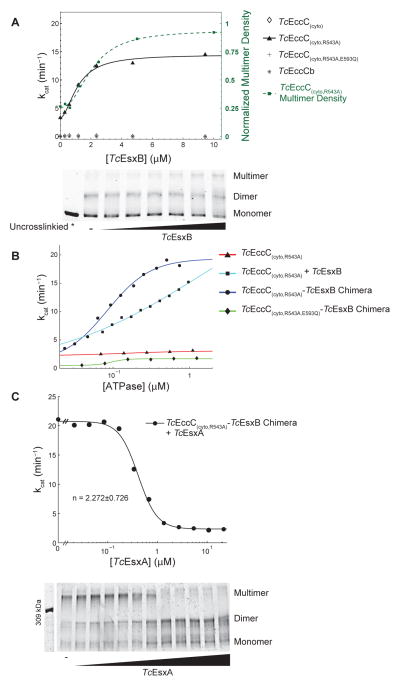
Figure 6. EsxB and EsxA substrates control EccC activity via regulating enzyme multimerization.
(A) The ATPase activity of the indicated TcEccC proteins was measured at different concentrations of TcEsxB. Multimerization of TcEccC(cyto,R543A), detected by glutaraldehyde crosslinking (bottom panel), increases with addition of TcEsxB (0–10 μM). Quantification of the multimer band is also indicated on the ATPase activity graph (green dotted line with squares) to demonstrate correlation between multimer concentration and activity. (B) ATPase activity of the indicated proteins, either TcEccC(cyto,R543A) +/− TcETc sxB EccC or (cyto,R543A)-TcEsxB chimeras, was measured as a function of enzyme concentration. In (B) and (C) each point represents the mean of three independent measurements. (C) ATPase activity of the TcEccC(cyto,R543A)-TcEsxB chimera was measured at different concentrations of TcEsxA (top panel), and multimerization of the enzyme in these reactions was assessed by glutaraldehyde crosslinking followed by SDS-PAGE (bottom panel - top concentration of TcEsxA is 22 μM and concentrations are reduced 2-fold in each lane to the left). See also Figure S5.

