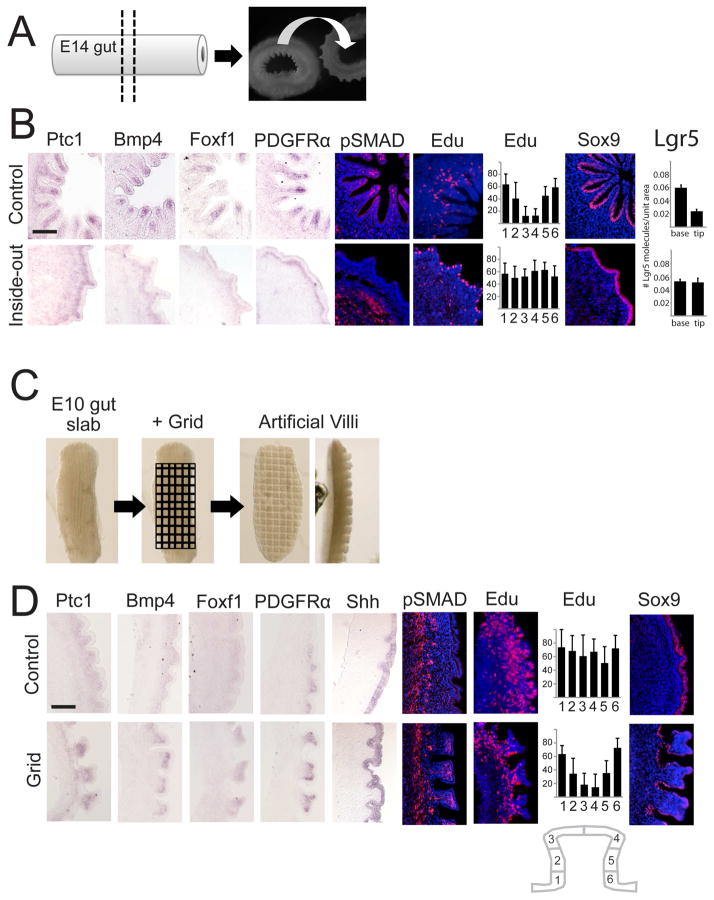
Figure 6. Epithelial shape directs cluster formation.
(A) Experimental schematic: a ring of E14 intestine (left) is cultured for 36 hours either as a control segment, or after first being flipped inside out (right). (B) After 36 hours in culture, the cluster signal arises in the control rings (top), similar to what would be found in an E15 intestine. The rings that were flipped inside out before culture have an epithelial shape similar to E13 intestine and concomitantly an in situ pattern and phosphoSMAD staining that matches expression at E13. Proliferation (quantified as in Figure 4), Sox9 expression, and Lgr5 expression are all lost from the tips of folds that form in the control rings. See also Figure S2. (C) Experimental schematic: a slab of E10 intestine (left) is cultured for 36 hours either as a control segment (where wide ridges will be maintained), or under a fine grid which induces many small villi-like bumps (right). (D) After 36 hours in culture, the cluster gene expression and phosphoSMAD staining in control segments is nearly uniform under the epithelium. However, samples grown under the grid form villi-like bumps and display non-uniform expression of cluster genes and BMP activity with highest expression in areas of highest curvature. Proliferation and Sox9 expression are uniform in the control epithelium but in the samples cultured under the grid, proliferation and Sox9 expression are lost from the tips of folds that form particularly in areas where the curvature is highest, and where clusters of mesenchymal expression arise. Data are represented as mean +/− one standard deviation. Scale bars, 50 μm.

