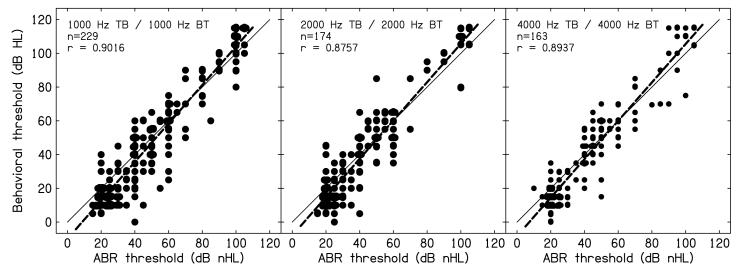
Figure 2.
Behavioral thresholds (BT) as a function of auditory brainstem response (ABR) thresholds for 1000 Hz (left panel), 2000 Hz (middle panel), and 4000 Hz (right panel). The number of observations (n) and the correlations are provided within each panel. The solid thin line is provided as a reference and has a slope of one. The dashed line represents a best-fit line to the data in each panel, and has a slope greater than one.

