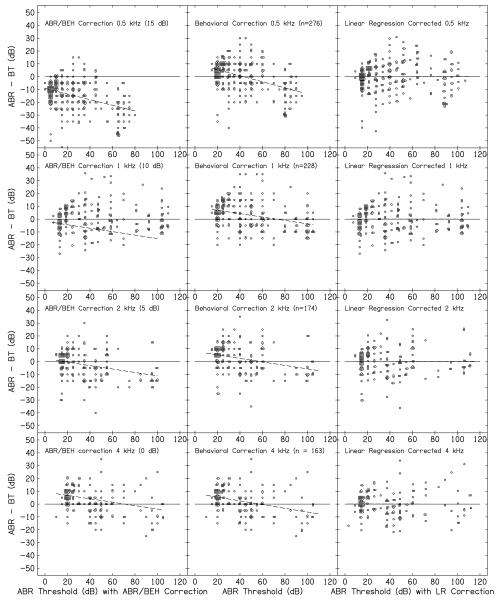
Figure 4.
The difference between auditory brainstem response (ABR) threshold and behavioral threshold (BT) as a function of the ABR threshold. Data for different frequencies (500, 1000, 2000, and 4000 Hz) are shown in each row and the results when different correction factors (BEH/ABR correction from Bagatto et al. 2010, BEH correction from Gorga et al. 2006, LR correction) were applied to the data are shown in each column. The correction factors used by Bagatto et al. are provided in parentheses in each panel in the left column. The solid line at 0 dB is provided as a reference. Points above this line represent cases in which the ABR overestimated behavioral threshold while points below this line represent cases in which ABR thresholds underestimated behavioral thresholds. Dashed lines within the panels in the left and middle columns are best-fit lines to the data. No dashed line is shown in the right column the application of the LR correction results in a line at 0 dB with a slope of zero.

