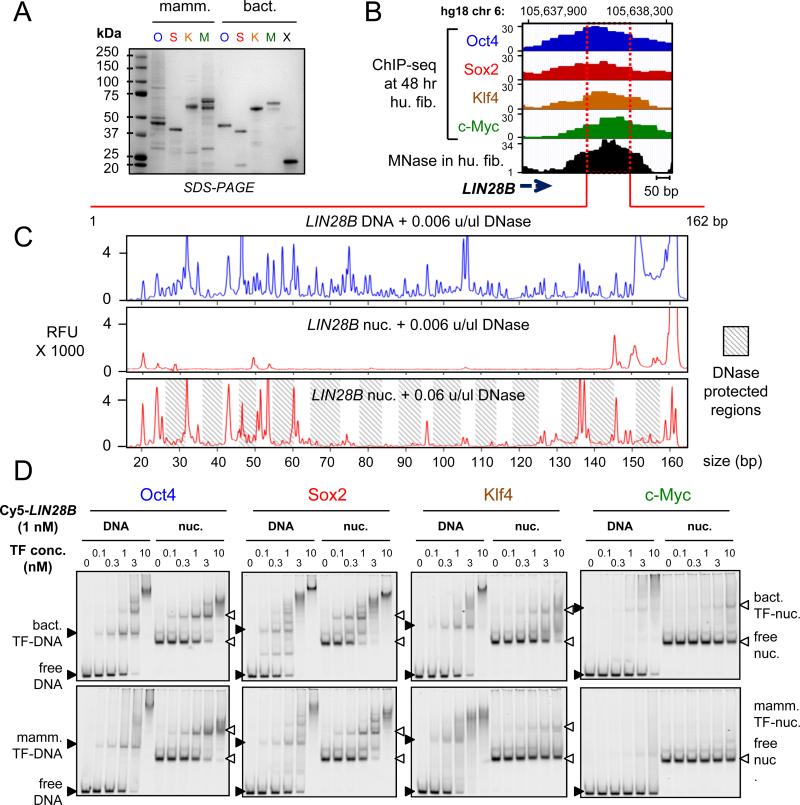
Figure 1. O, S, K, and M display differential affinity to nucleosomes in vitro.
(A) Recombinant purified mammalian and bacterial O, S, K, M, and bacterial Max (X) proteins analyzed bySDS-PAGE and Coomassie staining. The respective OSKMX bands run at the expected sizes when compared to the sizes of protein standards. The OSKM DNA binding activity and specificity is shown in Figure S1A-C.
(B) O, S, K, and M ChIP-seq profiles (blue, red, orange, and green, respectively) 48 hr post-induction, and MNase-seq profile (black) in fibroblasts across the LIN28B locus within the displayed genomic location.
(C) DNase-I footprinting showing the protection of LIN28B-DNA before and after nucleosome reconstitution in vitro. Electropherograms of 5’-6FAM end-labeled LIN28B (top strand) oligonucleotides generated by digesting free DNA (blue) and nucleosomal DNA (red) with DNaseI. The amount of DNase-I used are indicated on top of each panel. Shaded boxes represent the DNase-I protected regions within LIN28B-nuc in the expected ~ 10 bp pattern. See Figure S1D for details about nucleosome reconstitution.
(D) Representative EMSA showing the affinity of increasing amounts of recombinant O, S, K, and M proteins (bact. top panels and mamm. bottom panels) to Cy5-labelled LIN28B-DNA (left panels) and LIN28B-nucleosome (right panels). EMSA of O, S K, and M to DNA probes containing specific and non-specific targets are shown in Figure S1B and S1C.

