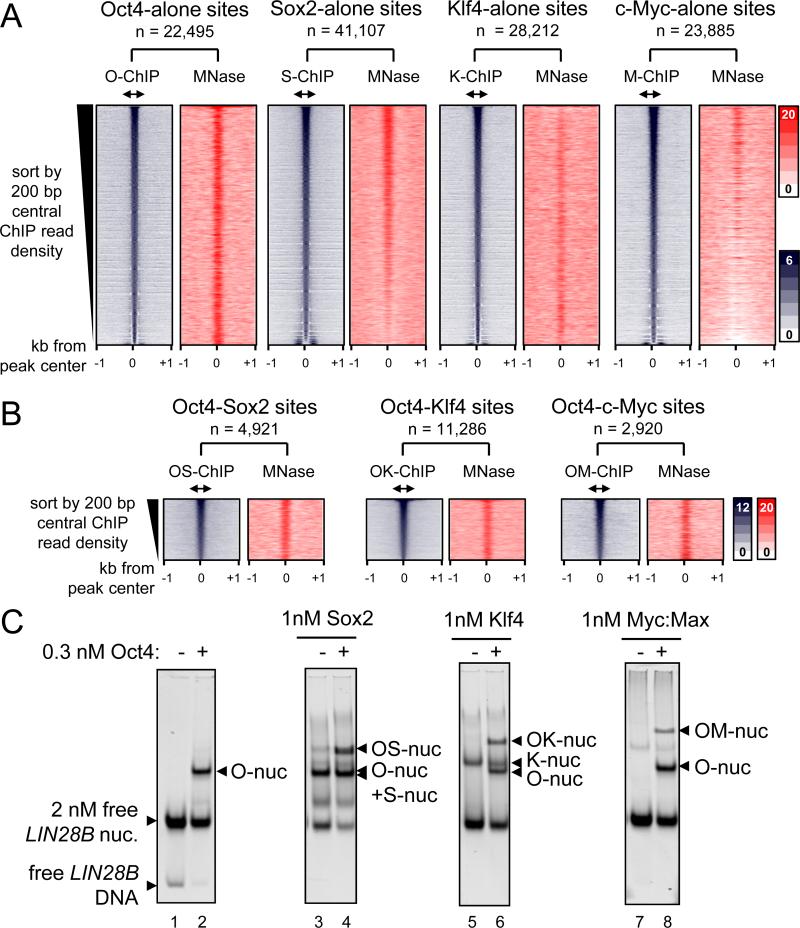
Figure 3. O, S, K, and M display a range of nucleosome targeting in vivo.
(A) Read density heatmaps (in color scales) showing the intensity of O, S, K, and M ChIP-seq signal (blue) and MNase-seq (red) spanning ± 1 kb from the center of the O, S, K, and M peaks where each factor binds alone within 500 bp threshold. The analyzed sequences were organized in rank order, from high to low number ChIP-seq reads within the central 200 bp (double arrows). The number of targeted sites is indicated.
(B) As in (A), but showing where the OS, OK, and OM factors peaks are within 100 bp or less apart from each other. The full possible OSKM combinations are shown in Figure S3.
(C) The binding affinity of S, K, and M (1 nM) in the presence of Oct4 (0.3 nM) to LIN28B nucleosomal DNA (lanes; 4, 6, and 8, respectively) or absence of Oct4 (lanes; 3, 5, and 7). The binding of Oct4 on its own (lane 2) and free LIN28B nucleosomes (lane 1) are indicated. The histone content of the nucleosome bound complexes are shown in Figure S4.

