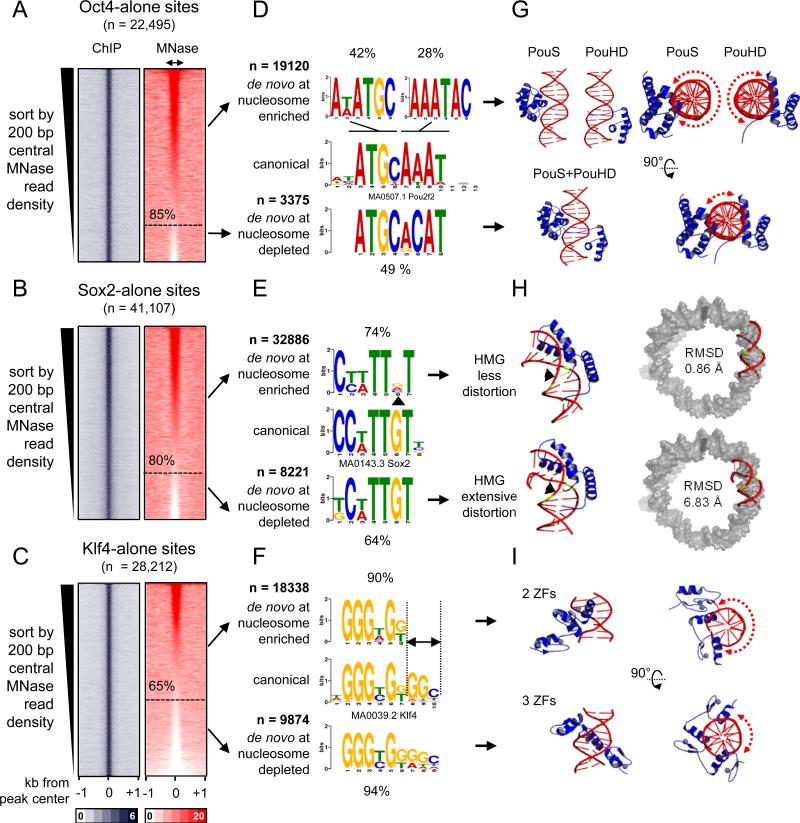
Figure 4. O, S, and K recognize partial motifs on nucleosomes.
(A-C) Same as in Figure 3A, but the sites were organizing in a descending rank order according to the MNase-seq tags within the central 200 bp. The nucleosome enriched sites were separated from the nucleosome depleted sites (dashed line) for each factor. (D-F) Logo representations of de novo motifs identified in the O, S, and K nucleosome-enriched targets (top) and nucleosome-depleted targets (bottom). The motifs were aligned to canonical motifs (middle). The number of targets analyzed and percentage of motif enrichments are indicated.
(G-I) Cartoon representations of the 3-D structures of O (PDB-3L1P), S (PDB-1GT0), and K (PDBs-2WBS and 2WBU) DBDs in complexes with DNA containing canonical motifs. Side and top views are shown for O and K and dashed curved arrows are shown to represent the extent of exposed DNA surface (G and I). The 3-D structure of the less distorted DNA (top) and extensively distorted DNA (bottom) were superimposed on nucleosomal DNA (PDB-3LZ0, gray) to display the extent Sox2-nucleosome binding compatibility by measuring RMSD of the fit.

