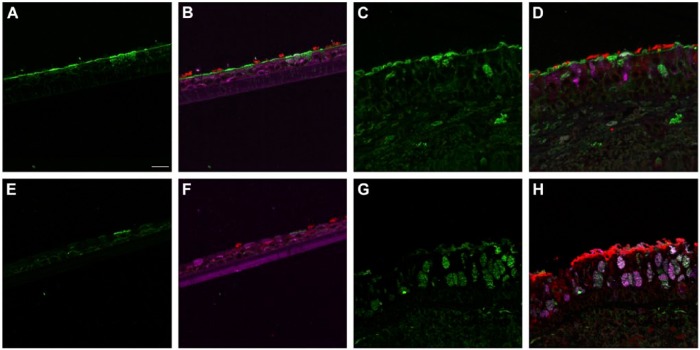
Figure 3.
Influenza receptor lectin distributions in normal human bronchial epithelial (NHBE) cells and distal trachea. Leica SP5 white light laser confocal maximum projection images of full thickness z-stacks of immunofluorescence-labeled, formalin-fixed, paraffin-embedded cells and tissues. All imaging was done with a 40× oil objective at zoom 2.0, 2048×2048 pixels. (Row 1, A–D) Sambucus nigra labeling of differentiated NHBEs and distal trachea, lectin labeling alone, A and C, and lectin labeling with ciliated and goblet cell markers, B and D. (Row 2, E–H) Maackia amurensis II labeling of differentiated NHBEs and distal trachea, lectin labeling alone, E and G, and lectin labeling with ciliated and goblet cell markers, F and H. The pseudo-colors are receptor lectins (green), goblet cells (magenta) and ciliated cells (red). Yellow indicates co-localization between a receptor lectin and the ciliated cell marker. White indicates co-localization between a receptor lectin and the goblet cell marker. Scale, 20 µm.

