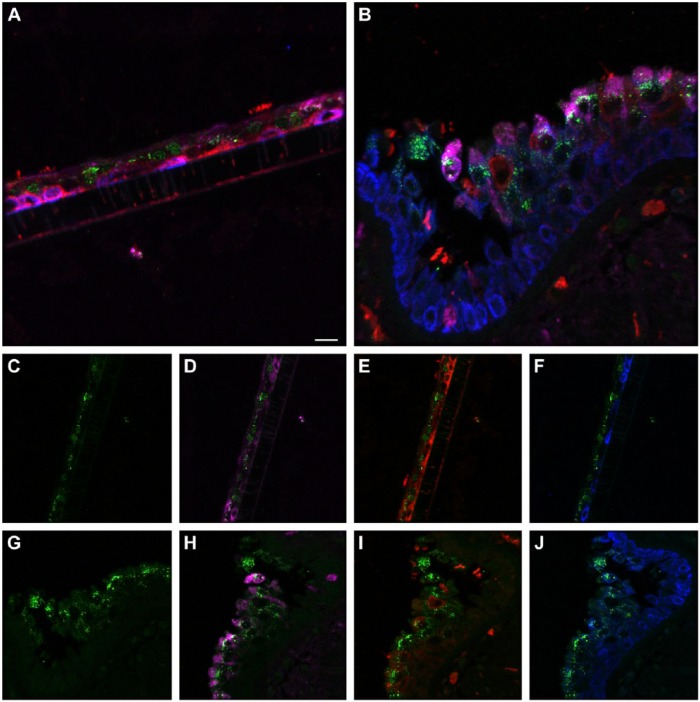
Figure 6.
Comparison of influenza antigen distribution by cell type. Pandemic 2009 influenza-infected normal human bronchial epithelial (NHBE) cells and human trachea. Leica SP8 laser confocal maximum projection images of full thickness z-stacks of immunofluorescence-labeled, formalin-fixed, paraffin-embedded NHBE cells and human trachea. All imaging was done with a 40× oil objective at zoom 1.5, 2048×2048 pixels. The pseudo-colors are influenza antigen (green), goblet cells (magenta), ciliated cells (red) and basal cells (blue). Yellow indicates co-localization between influenza antigen and the ciliated cell marker. White indicates co-localization between influenza antigen and the goblet cell marker. Cyan indicates co-localization between influenza antigen and the basal cell marker. (Row 1; A) Ca04-infected NHBE cell layer at 24 hr post-infection. (Row 1; B) Trachea from an autopsy of an individual who died from infection with a 2009 pandemic virus strain. (Row 2) Infected NHBE cells: (C) influenza antigen labeling only, followed by influenza antigen merged with ciliated, goblet and basal cell markers individually (D–F). (Row 3) Infected human trachea: (G) influenza antigen labeling only, followed by influenza antigen merged with ciliated, goblet and basal cell markers individually (H–I). Scale, 10 µm.

