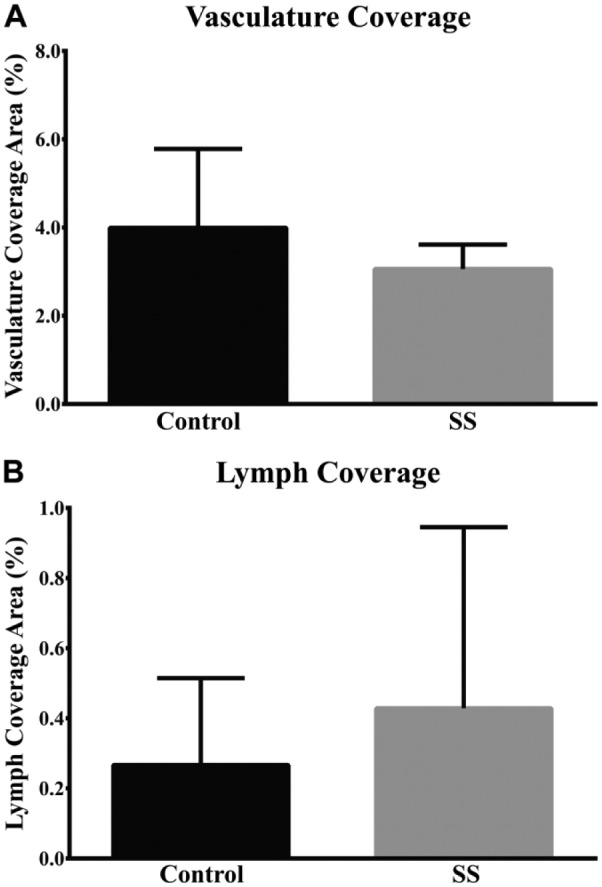
Figure 5.

Blood (A) and lymphatic (B) vessel coverage was not significantly different between non-Sjögren’s syndrome and Sjögren’s syndrome human minor salivary glands. Mosaic images, as illustrated in Figs. 2 and 3, were quantified for blood and lymphatic vessel volume fraction as described in the Materials & Methods. Data are expressed as a ratio of blood or lymphatic vessel volume fraction and expressed as the mean ± S.D. (n=6).
