
Figure 2.
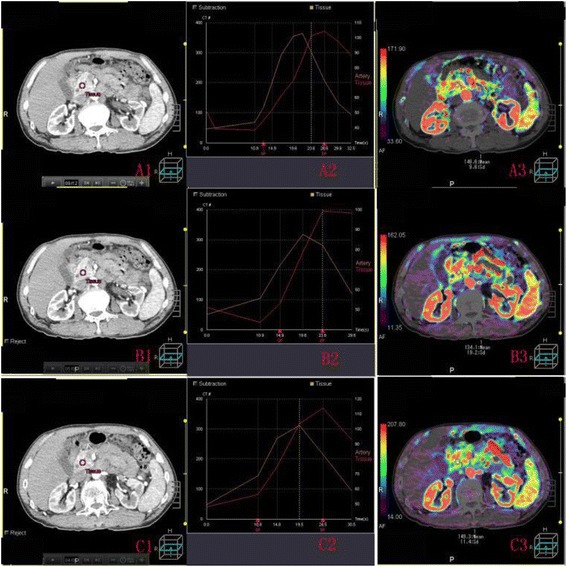
ROI, time density curve and blood flow image of normal pancreas. A1(B1,C1) shows the ROI of normal pancreas without any pancreatic disease in whole sequence (odd number sequence,even number group). A2 (B2,C2) represents the corresponding time density curve; A3 (B3,C3) represents the blood flow image.