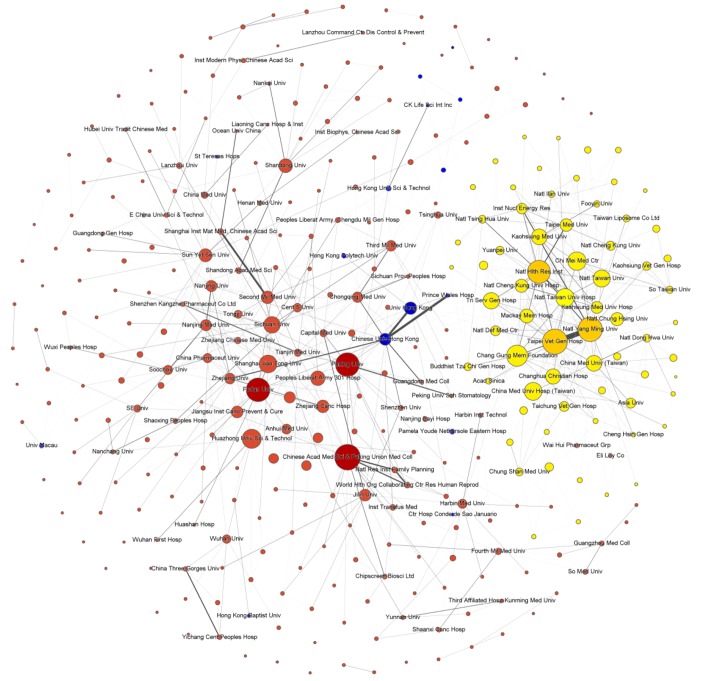
Figure 2.
Institutional collaboration network of anti-cancer drug research in China. This network was visualized and analyzed by using Gephi that is an open-source software for complex systems analysis and visual exploration of networks (13). This figure is composed of 342 nodes and 5,168 weighted edges. A node represents a China’s research institution and the node-size reflects the unweighted degree of an institution (i.e., the number of neighbors of the institution by co-publication connection). The strength of edges corresponds to edge weights measured by the frequency of co-publication between researchers of two institutions. Red nodes are the institutions located within the Chinese mainland, yellow are Taiwan’s institutions, and blue are Hong Kong’s and Macao’s institutions. Moreover, some remarkable notes are labeled as abbreviation names of institutions.

