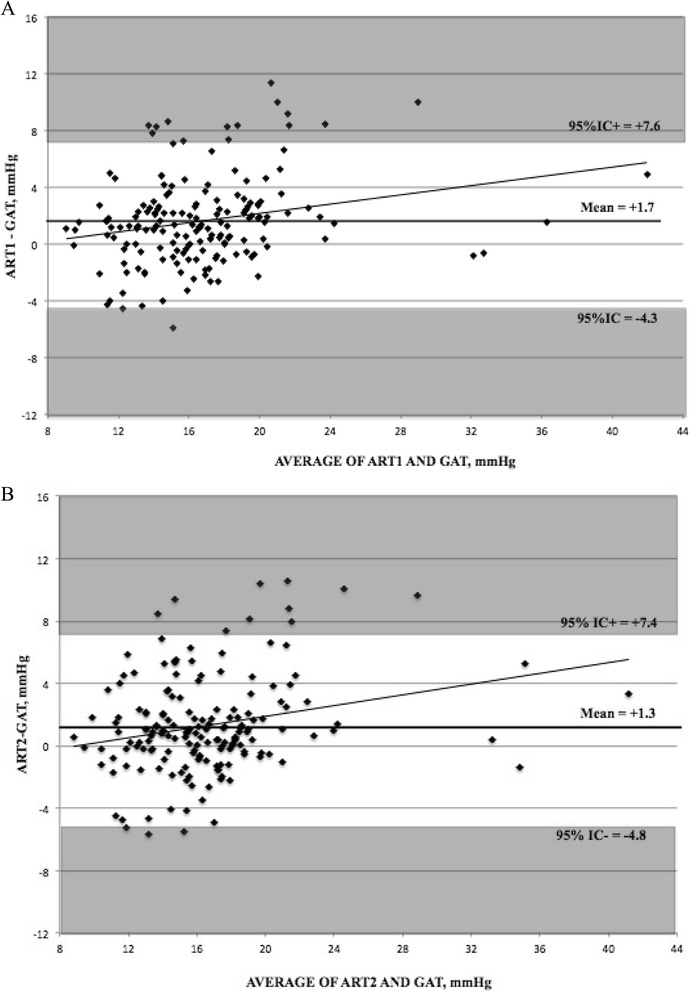
Figure 2.

Bland-Altman plots for (A) the first measurement using applanation resonance tonometry (ART1) and Goldmann applanation tonometry (GAT) and (B) the second measurement using ART (ART2) and GAT.

Bland-Altman plots for (A) the first measurement using applanation resonance tonometry (ART1) and Goldmann applanation tonometry (GAT) and (B) the second measurement using ART (ART2) and GAT.