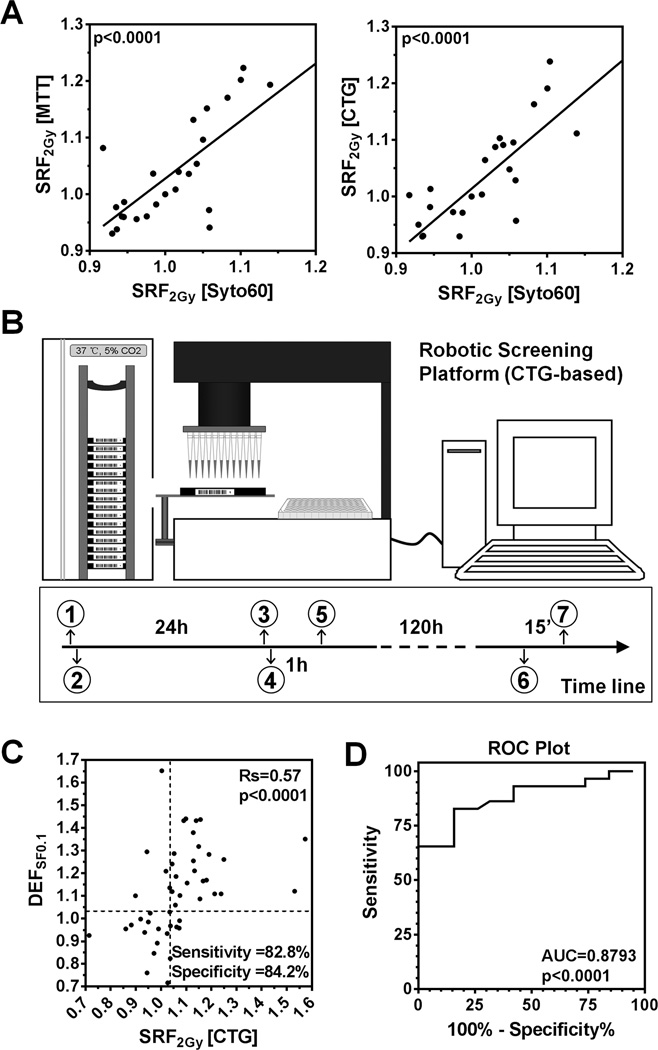
Figure 3. Establishing a robotic cell line screening platform.
A) Comparison of the syto60 assay with the MTT or CTG assay. Solid lines and p-values represent results of linear regression analysis. Each data point is based on three biological repeats. B) Illustration of the robot-assisted screening process. (1) Prepare duplicate plates (mock-treatment, IR 2 Gy), (2) Seed one cell line per plate, (3) Prepare master drug plate, (4) Load plates, add drugs via robot, and incubate, (5) Treat plates and return to incubator, (6) Add CTG agents, (7) Read plates. C) Correlation of SRF2Gy values obtained with the 5-day robotic CTG assay and DEFSF0.1 values analogous to Fig. 1E. For sensitivity and specificity calculations, cut-offs of ≥1.04 for SRF2Gy and ≥1.03 for DEFSF0.1 were chosen to define a positive effect. Data points represent 48 comparisons based on 9 cell lines and 12 targeted agents. D) ROC plot analogous to Fig. 1F.

