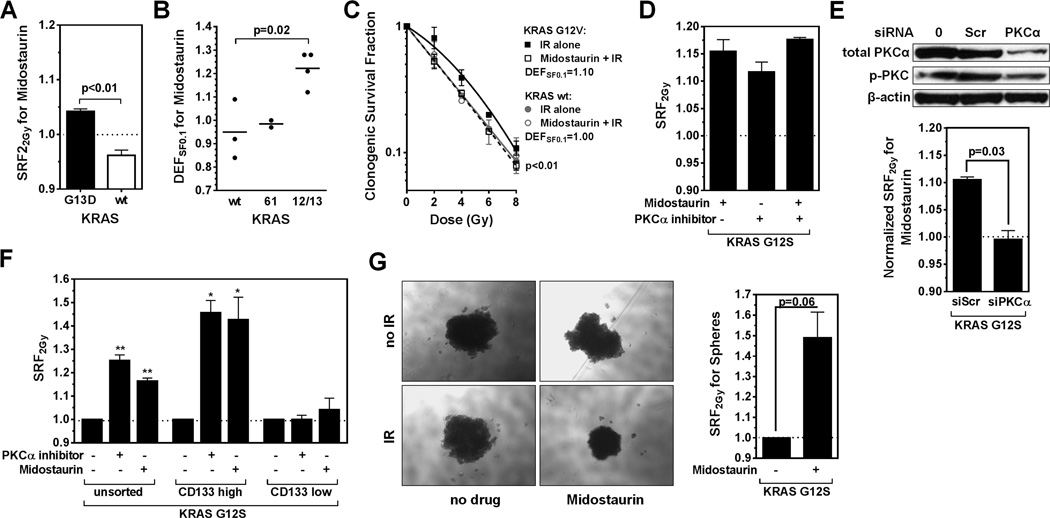
Figure 5. Follow-up analysis on the radiosensitizing effects of midostaurin.
A) SRF2Gy values for isogenic DLD-1 cells harboring a mutant KRAS or a deleted allele. B) DEFSF0.1 values derived from clonogenic survival curves according to KRAS status of non-isogenic lung cancer cell lines. Statistical comparison with t-test. C) Clonogenic survival of isogenic KRAS wild-type NCI-H1703 cells with or without stable expression of a mutant KRAS transgene. Data were fitted using the LQ formula, and statistical comparison was performed with the F-test. D) SRF2Gy values for KRAS-mutated A549 cells treated with midostaurin or the PKCα-specific Ro-32-0432 inhibitor (100 nM). E) Effect of PKCα depletion: Upper panel, Western blot of A549 cells transfected with no reagents (0), a scrambled control (scr), or siRNA against PKCα. p-PKC indicates a pan-antibody against phospho-PKC isoforms. Lower panel, SRF2Gy values for midostaurin with or without PKCα depletion. Statistical comparison with T-test. F) SRF2Gy values in A549 populations based on treatment with midostaurin or Ro-32-0432 following no sorting, sorting for high CD133 expressors, and sorting for low CD133 expressors. Statistical comparisons to IR alone with one-sample T-test, *, p≤0.05, **, p≤0.01. G) Left panel: representative images of A549 spheres following treatments as indicated. Right panel, quantification of results using the CTG assay. Statistical comparison with T-test. All data points shown represent mean +/− standard error based on at least three biological repeat experiments.

