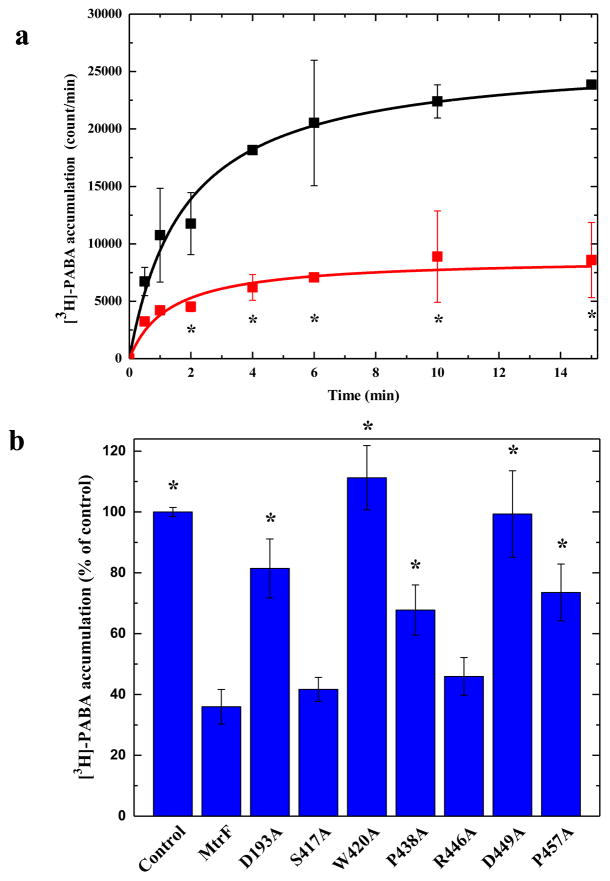
Fig. 3.
Accumulation of radioactive p-aminobenzoic acid. (a) Time course of [3H]-PABA accumulation by E. coli BL21(DE3)ΔabgTΔpabA double knockout cells transformed with pET15bΩmtrF or pET15b. Cells expressing mtrF (red curve) show a significant decrease in [3H]-PABA accumulation when compared with cells carrying the empty vector (black curve). “*” indicates values of BL21(DE3)ΔabgTΔpabA/pET15bΩmtrF cells that are significantly different from the control (BL21(DE3)ΔabgTΔpabA/pET15b) values (P < 0.05). (b) Mutants of the MtrF transporter. Cells possessing the mutant transporter D193A, W420A, P438A, D449A and P457A show a significant increase in the level of [3H]-PABA accumulations compared with cells expressing wild-type MtrF. However, cells expressing S417A and R446A only show a modest change on the [3H]-PABA concentration when compared with cells carrying wild-type MtrF. “*” indicates values of BL21(DE3)ΔabgTΔpabA/pET15b and BL21(DE3)ΔabgTΔpabA cells expressing the mutant transporters that are significantly higher than that of BL21(DE3)ΔabgTΔpabA/pET15bΩmtrF expressing wild-type MtrF (P < 0.009). The data showed in (a) and (b) are the cumulative average of three successive recordings.

