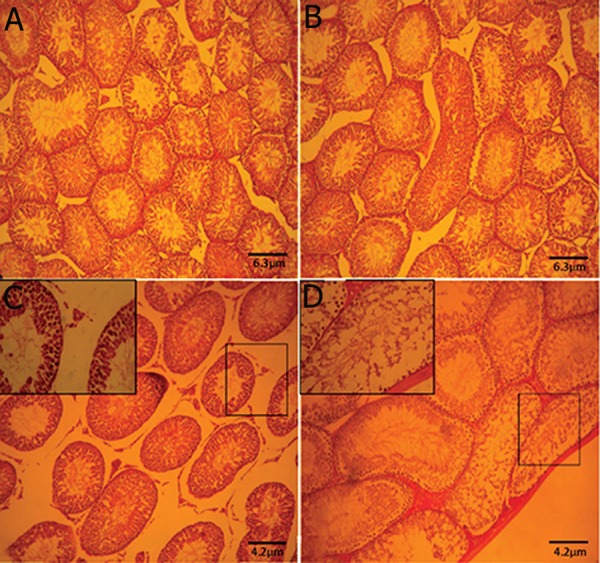
Fig.2.

Cross-section from testis. (A) Control group. (B) Control-sham group: Note the normal seminiferous tubules with normal spermatogenesis. (C) and (D) Phosalone (PLN)-induced group: severe edema in connective tissue associated with tubular atrophy. Note the seminiferous tubules with negative tubular differentiation index (TDI) (magnified in figure C) and tubular depletion (TD) close to the capsule (magnified in figure D). Haematoxylin and eosin (H&E) staining (×400).
