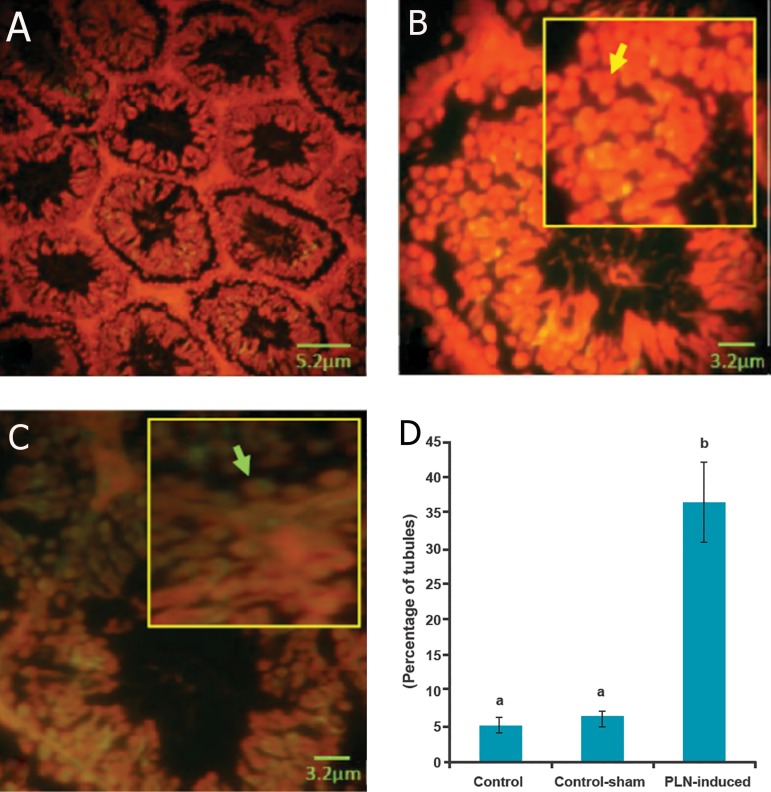
Fig.5.
Cross-section from testis. (A) Control group. (B) Higher magnification from normal seminiferous tubule. Note the normal RNA content marked with bright, intensive fluorescent red in the germinal epithelium (yellow arrow). (C) Phosalone (PLN)-induced testis: remarkable RNA damage was shown by the faint fluorescent reaction (green arrow). The germinal cells exhibited lower RNA content versus normal cells in figure B. Epi-fluorescent analysis for RNA damage (A: ×400 and B, C: ×600). (D) Mean percentage of seminiferous tubules with RNA damage in different groups (n=6 rats per group). Data are mean±SD.
a; No significant and b; Significant differences (p<0.05) between data for PLN-administered (150 mg/kg) group with control and controlsham groups.

