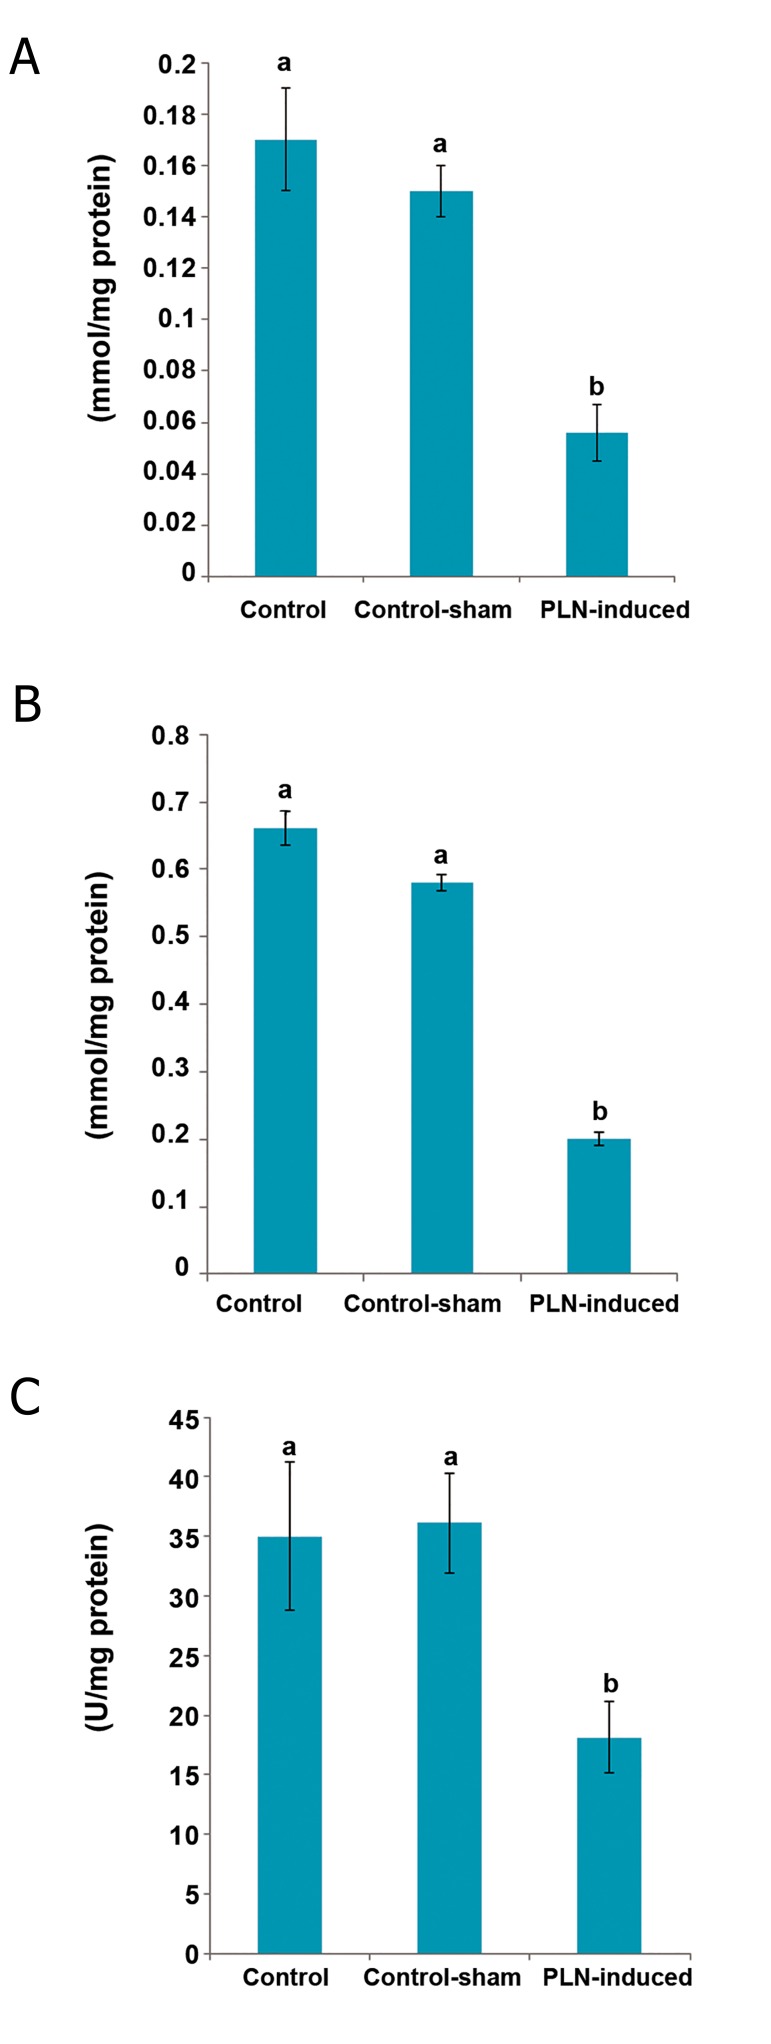
Fig.8.
Effect of phosalone (PLN) on tissue (A) total antioxidant capacity (TAC), (B) total thiol molecules (TTM) and (C) glutathione peroxidase (GSH-px) compared to control and control-sham groups (n=6 rats for each group). Data are mean±SD.
a; No significant and b; Significant differences (p<0.05) between data for PLN-administered group with control and control-sham groups.

