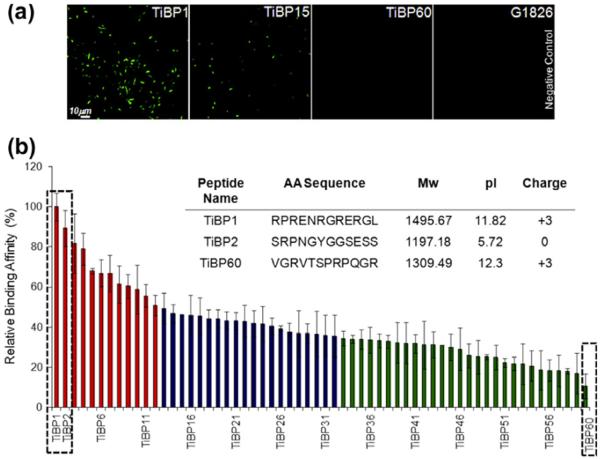
Fig. 1.
Ti binding peptides (TiBP) selected by cell surface display: (a) examples of FM images of TiBP with various binding affinities; (b) categorization of the Ti binding clones based on relative binding affinity analysis via FM. (b inset) Amino acid (AA) sequence and physicochemical properties of TiBP1, TiBP2 and TiBP60 (Mw: Molecular Weight, pI: Isoelectric point).

