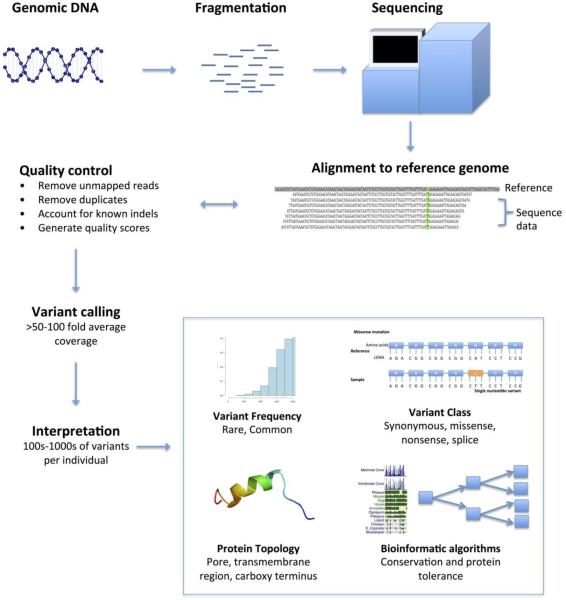
Figure 2. Illustration depicting the flow of next generation sequencing data.
The figure displays the basic processing steps involved in the performance and interpretation of next generation sequencing for an isolated individual undergoing exome sequencing. In addition to using bioinformatic annotations, pathogenicity of identified variants can be inferred by using information on functional characterization information and family segregation, if available.

