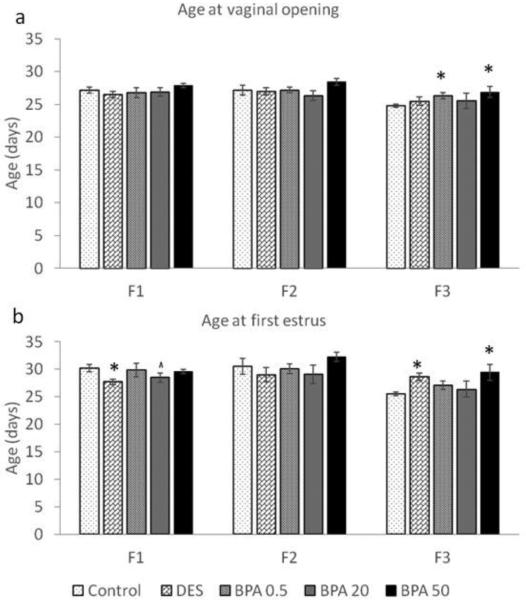
Figure 2.
The effects of in utero BPA exposure on timing of vaginal opening (a) and first estrus (b) in the F1-F3 generations. Graphs represent mean ± SEM from 9-15 dams per treatment group. Asterisks (*) represent a significant difference from the control group (p ≤ 0.05); ^ represent a borderline difference from the control group (p = 0.1)

