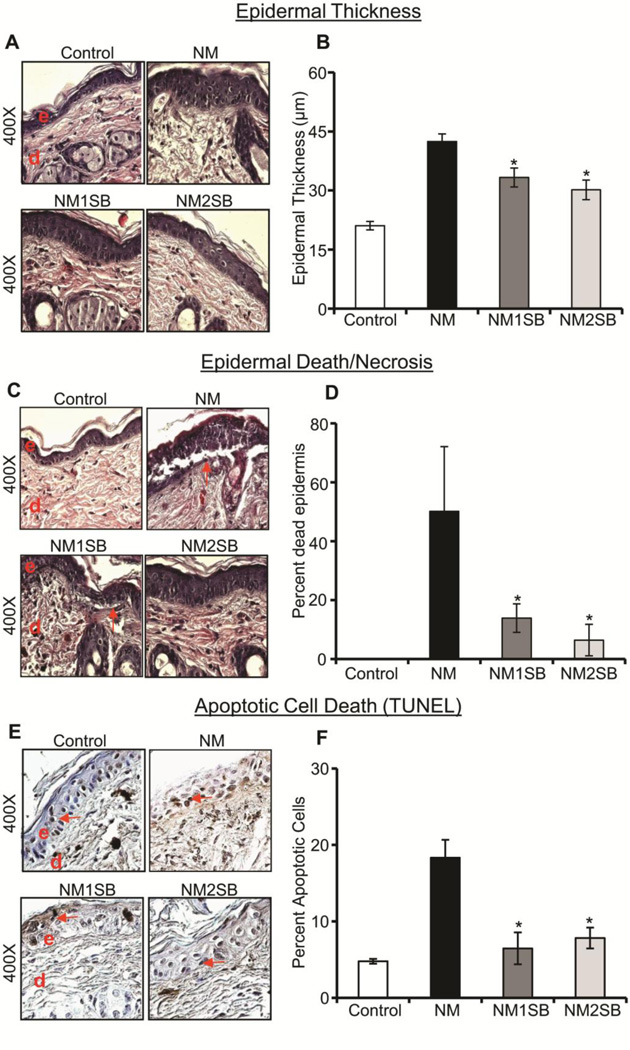
Figure 1. Effect of silibinin treatment on NM-induced epidermal thickness, death/necrosis and apoptotic cell death.
Following NM exposure and silibinin treatments, dorsal skin was used for both H&E staining and TUNEL analysis. (A) and (C) are representative pictures of epidermal thickness and epidermal death/necrosis from H&E stained skin sections, and (E) shows representative pictures from TUNEL staining at 24h. (B), (D) and (F) Depict quantitative data of epidermal thickness, epidermal death/necrosis and TUNEL positive cells, respectively. Data presented are the mean ± SEM from 4–5 animals. *, p<0.05 compared to NM exposed group. e, epidermis; d, dermis; red arrows, TUNEL positive cells.

