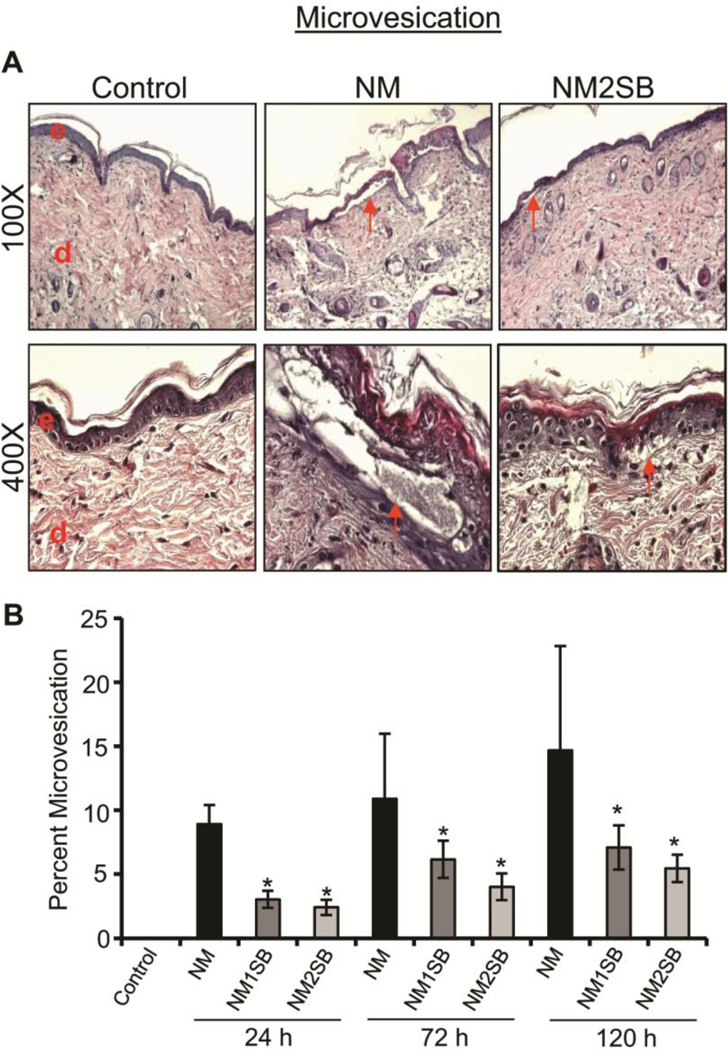
Figure 3. Effect of silibinin treatment on NM-induced microvesication.
H&E stained sections were analyzed for epidermal-dermal separation (microvesication). (A) Representative pictures of epidermal-dermal separation at 100X and 400X from control, NM exposed, and SB-treated groups. (B) Depicts the percent length of microvesication calculated as detailed in Materials and Methods. Data presented are the mean ± SEM from 4–5 animals. *, p<0.05 compared to NM exposed group. e, epidermis; d, dermis; red arrows, microvesication.

