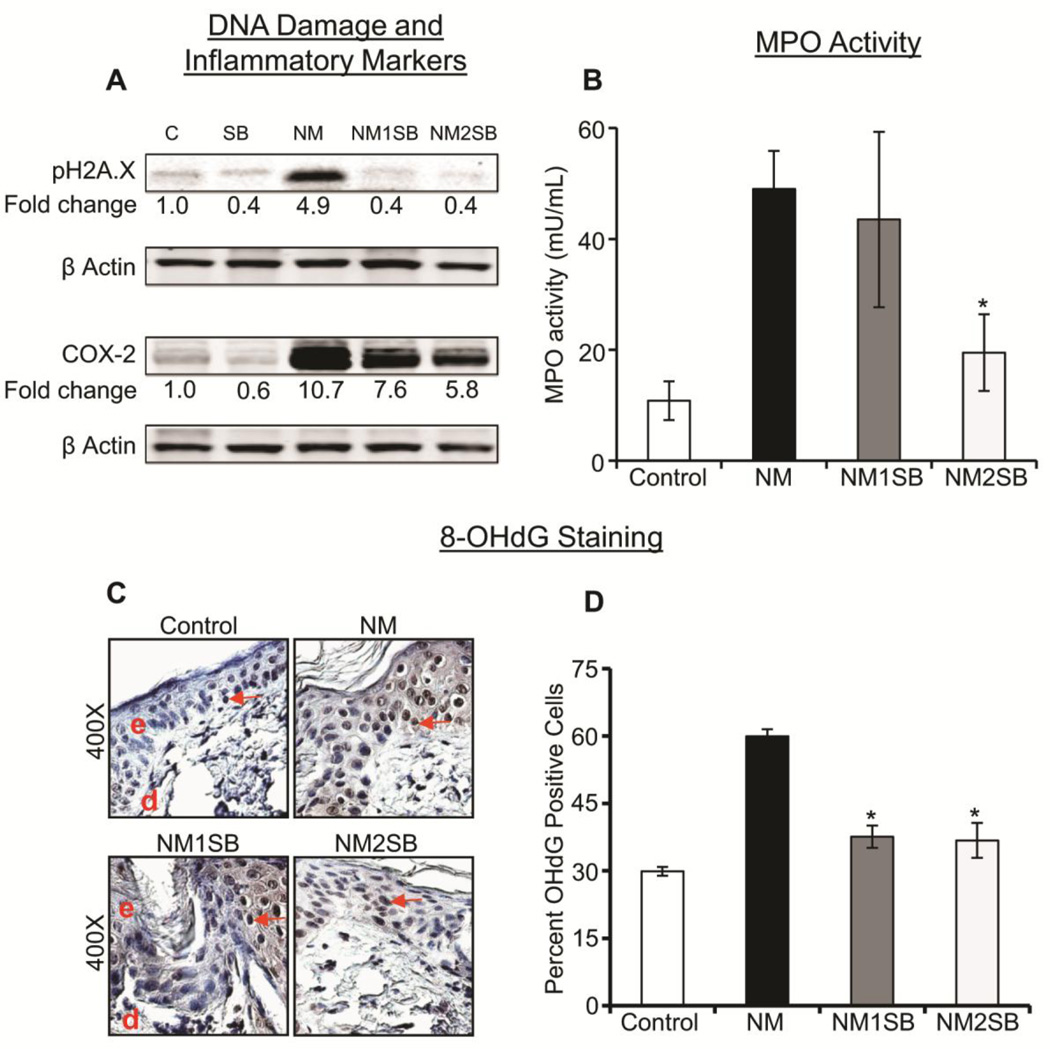
Figure 4. Effect of silibinin treatment on NM-induced H2A.X phosphorylation, COX-2 level, MPO activity and oxidative DNA damage.
Dorsal skin samples were collected following various treatments, and employed for western blot and immunohistochemical analyses. (A) Tissue lysates were analyzed by western blotting to observe the expression of Ser139 phospho-H2A.X at 72h and COX-2 at 120h post NM exposure, as detailed in Materials and Methods. For loading control, membranes were stripped and reprobed for β-actin. The intensity of bands was analyzed by densitometric analysis using image J software. (B) The frozen tissue from 120h time point was subjected to MPO assay as detailed under materials and methods. Oxidative DNA damage was visualized at 24h; as 8-oxodG staining by IHC analysis as detailed in Materials and Methods. (C) Representative images of 8-oxodG IHC staining, along with (D) quantitative data for 8-oxodG positive cells. Data presented are the mean ± SEM from 4–5 animals. *, p<0.05 compared to NM exposed group. e, epidermis; d, dermis; red arrows, 8-oxodG positive cells.

