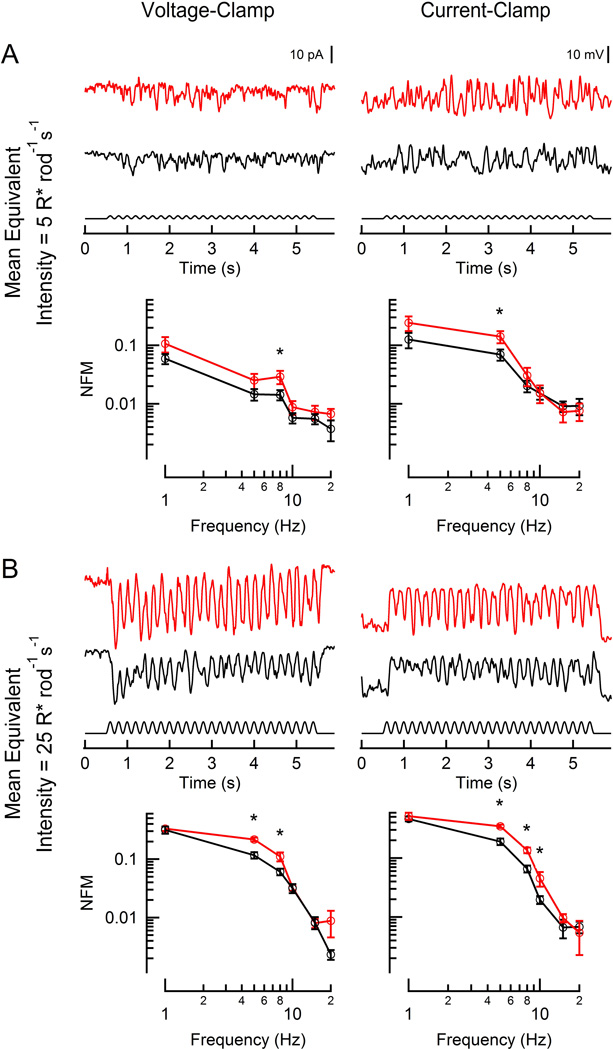
Figure 4. Responses of rod-driven DBCRs to flickering stimuli.
Representative light-evoked current (left) and voltage (right) responses from two rod bipolar cells (red: RGS9-ox background; black: WT) to flickering (100% contrast, 5 Hz). WT and RGS9-ox slices were stimulated at intensities generating equivalent rod suppression (A: 5 and 10 R* rod−1 s−1; B: 25 and 50 R* rod−1 s−1). Population average magnitude spectra are plotted below each sample trace for each condition. Each data point reflects between 3 and 15 determinations from a total of 7 RGS9-ox and 19 WT DBCRs. A statistically significant difference was observed at 5 or 8 Hz at the lowest equivalent intensity (A, left: p =0.034; A, right: p = 0.049) and between 5–10 Hz at the brighter equivalent intensity (B, left: p = 0.00040 and 0.011; B, right: p = 0.0021, 0.0017, 0.022). Error bars represent SEM. NFM: normalized fundamental magnitude. *p < 0.05

