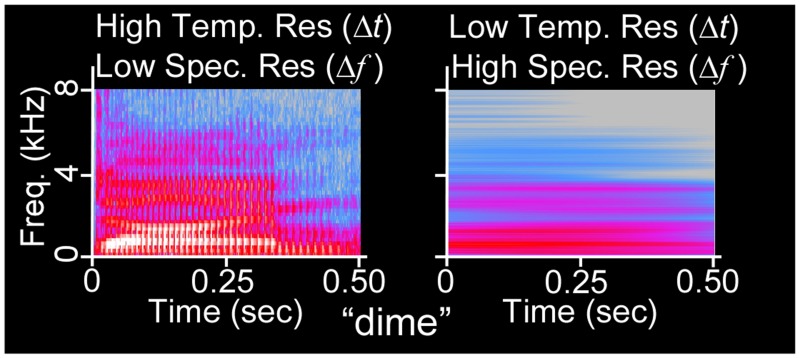
Figure 1.
Acoustic uncertainty as illustrated via spectrogram. The waveform of the 500 ms duration word “dime” (NU-6 List 1A) has been spectrographically analyzed using Fourier transforms with (left) narrow temporal integration windows (256 frequency channels, Hanning window) and (right) wide temporal integration windows (32768 frequency channels). At left, glottal pulses (vertical lines) and formant transitions (changes in vocal spectral peaks over time) are visible, whereas harmonics are not. At right, harmonics are visible, but the sequence of auditory events is confounded.

