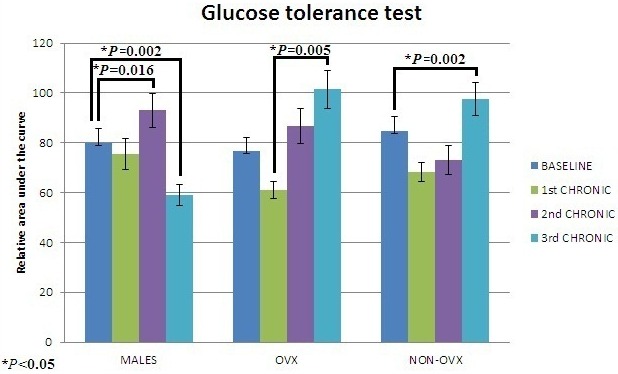
Figure 4.

Quantification of glucose tolerance test relative areas under the curve (AUC) of male, ovariectomized (OVX), and non ovariectomized (NON-OVX) animal groups upon no stress (baseline) and three sessions of chronic stress. Statistical significance level was set to P < 0.05.
