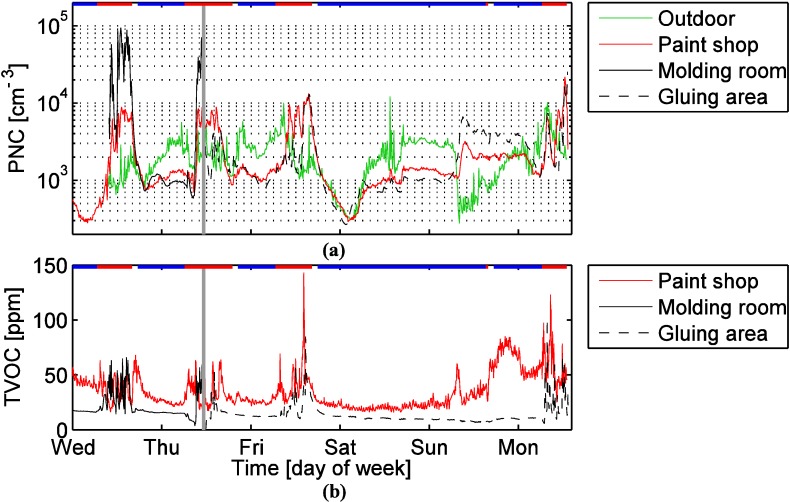
Figure 3.
(a) Particle number concentrations at 10 minute resolution. (b) TVOC concentrations at five minute resolution. The horizontal red lines show the working hours and the horizontal blue lines show non-working hours. The vertical gray line shows when the instruments were moved from the molding room to gluing area.

