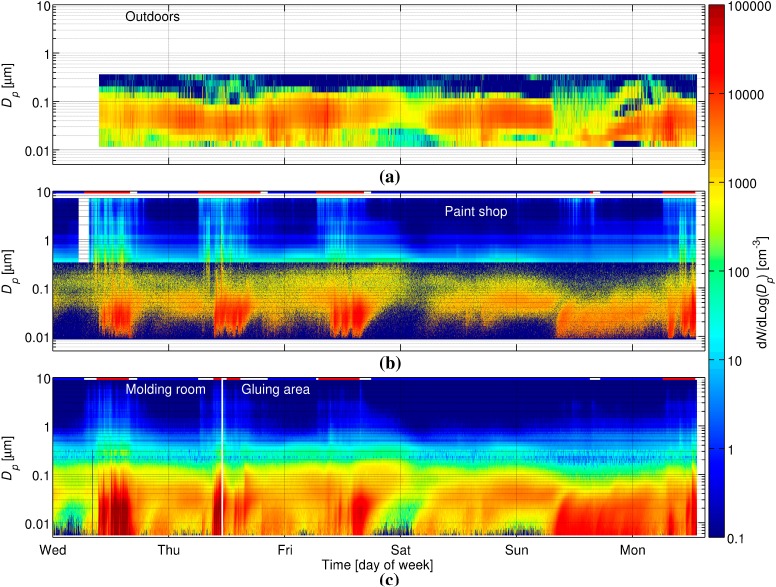
Figure 4.
Particle size distribution time series. (a) Outdoors measured by NanoScan, (b) in the paint shop measured by SMPS and OPS, and (c) in the molding room (Tuesday 16:14–Thursday 11:04) and the gluing area (Thursday 11:07–Monday 13:20) measured by SMPS + C and DM). In figure (b) and (c) horizontal red lines shows the working hours in the respective locations and blue lines non-working hours.

