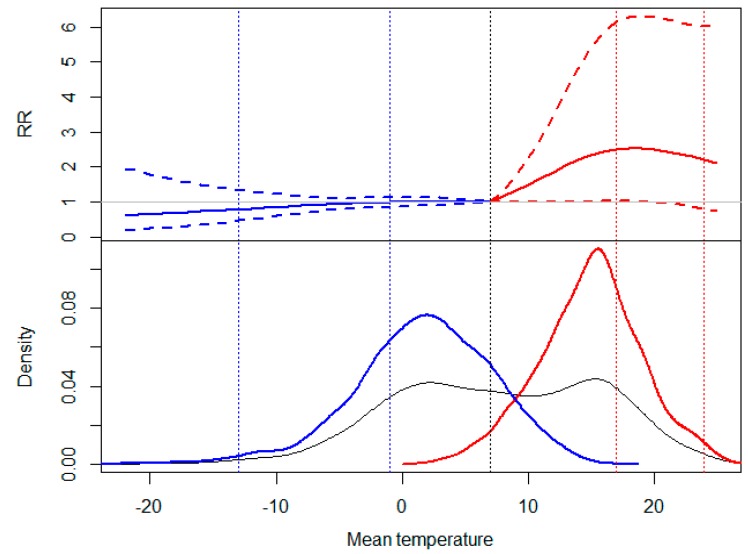
Figure 1.
Top: Cumulative risk ratio (RR) and 95% confidence interval of preterm birth up to 30 days by mean temperature. Bottom: kernel distribution graphs of the mean temperature (Grey: entire annual period; Red: warm season; Blue: cold season). Vertical dashed lines in different mean temperature values: 1st and 25th percentile of the cold season (–13.1 °C; –1.5 °C), mean value of the entire annual series (black, long dash) (7.7 °C), and 75th and 99th percentile of the warm season (17.5 °C; 24 °C).

