Figure 5.
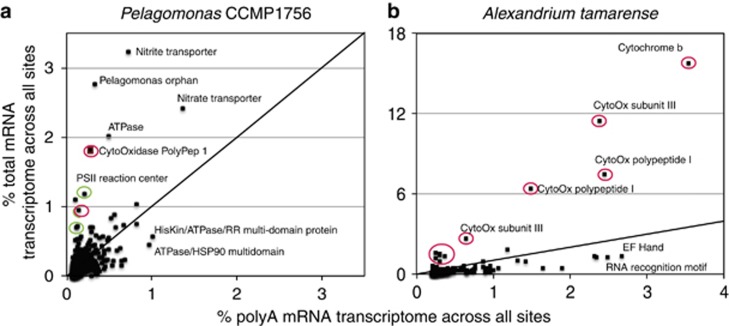
Comparisons of transcriptomes for two eukaryote populations. The representation of genes for Pelagomonas (a) and Alexadrium (b) like organisms in polyA and total mRNA transcriptomes is shown as the percentage of transcriptome for each organism. Genes known to be encoded by organelle genomes are indicated in green (chloroplast) and red (mitochondria). Select points that fall off the 1:1 line (black) are annotated.

