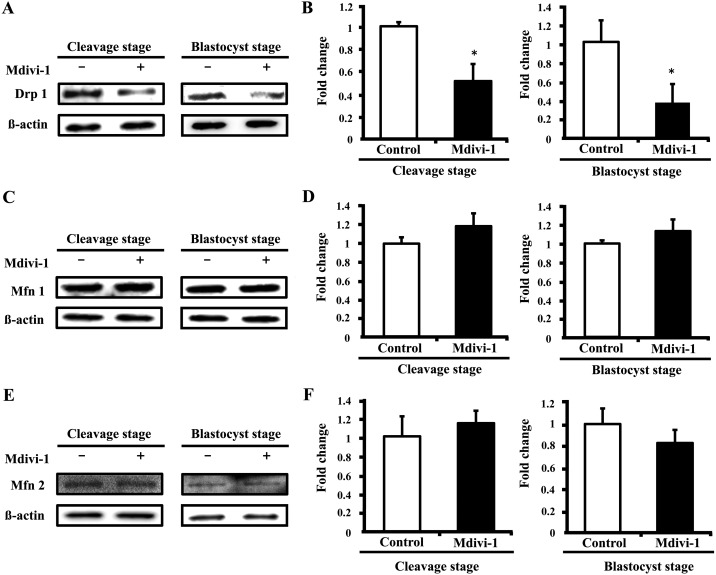
Fig. 2.
Comparative analysis of the expression of mitochondrial fission proteins in cleavage- and blastocyst-stage embryos. Representative Western blot analysis of Drp 1 (A), Mfn 1 (C), Mfn 2 (E), and β-actin protein. Quantification of signals from Western blots showing the fold change in Drp 1/β-actin protein (B), Mfn 1/β-actin protein (D), and Mfn 2/β-actin protein (F) expression. Values are shown as the mean ± SD. Statistically significant differences are indicated by asterisks (P < 0.05).

