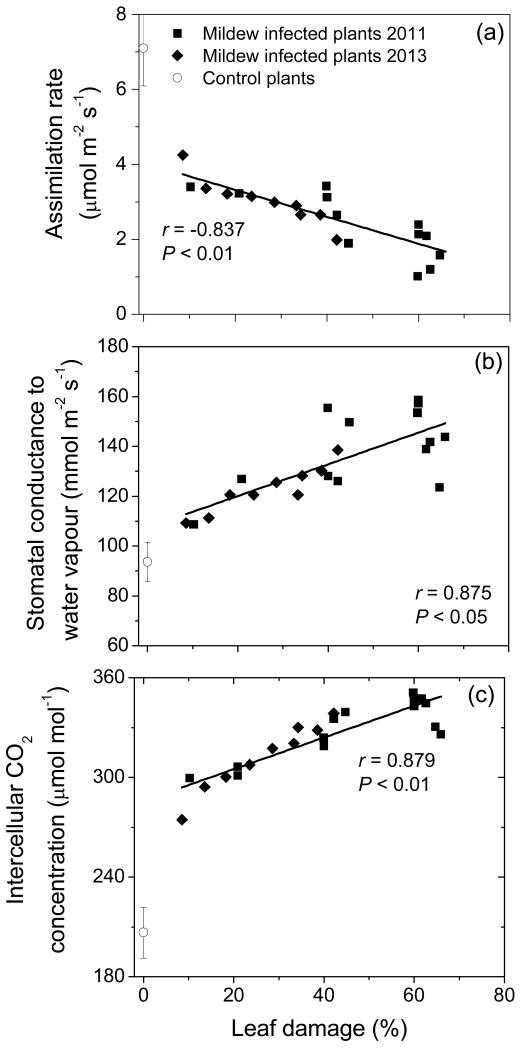
Figure 2.
Leaf net CO2 assimilation rate (a), stomatal conductance to water vapor (b) and intercellular CO2 concentration in relation to the percentage of leaf area (upper surface) infected with Erysiphe alphitoides in Quercus robur. The data correspond to different leaves and the relationships were fitted by linear regressions. Values for visually completely healthy non-infected leaves are shown by open symbols. Data are shown separately for 2011 and 2013 measurement campaigns.

