
Figure 3.
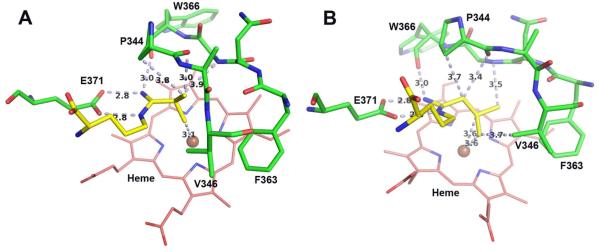
Models of (A) 10 and (B) 11 right after the initial minimization. Major distances less than 4.0 Å are marked in Å including the three H-bonds that anchor the inhibitor to the NOS active site glutamate. The figure was prepared with PyMol (www.pymol.org).