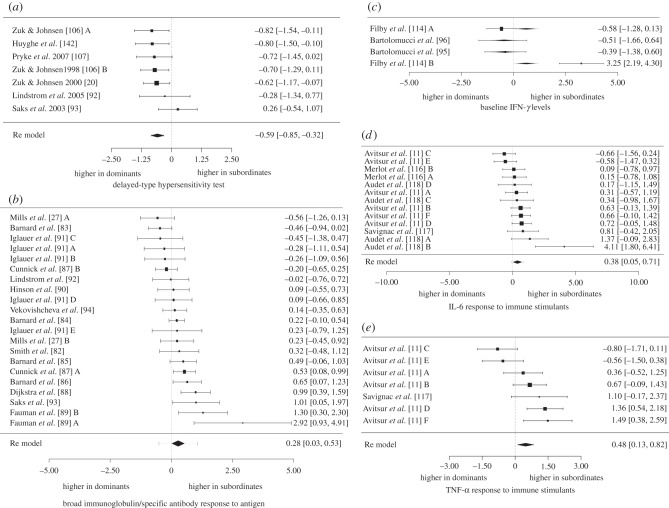
Figure 3.
Forest plots showing effect sizes for the five tests of immune response that demonstrated a significant relationship with social status in table 2. Positive values indicate higher responses in subordinates; negative values indicate higher responses in dominants. Plots include the effect sizes for (a) DTH responses to immune stimulants, (b) immunoglobulin responses to antigens, (c) baseline IFN-γ levels, (d) IL-6 response to immune stimulants and (e) TNF-α response to immune stimulants. Values in brackets represent the 95% CI lower limit and the 95% CI upper limit; the value outside brackets represents the effect size (d) of each study. Letters following an author's name represent studies of the same test on multiple, independent populations. In (c), which shows baseline IFN-γ levels, grey diamonds represent a fitted value for each study that incorporates taxa as a moderator.

